| Map | Pie | Office | Total | D | R | I | Margin | %Margin | Dem | Rep | Ind | Oth. | Dem | Rep | Ind | Other | | | | | | | | | | | | | | | | | | |
|---|
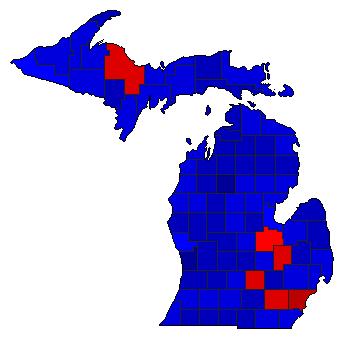
 |  | Senator |
3,121,775 |
1 |
2 |
0 |
414,737 |
13.29% |
54.61% |
41.33% |
0.00% |
4.06% |
1,704,936 |
1,290,199 |
0 |
126,640 |
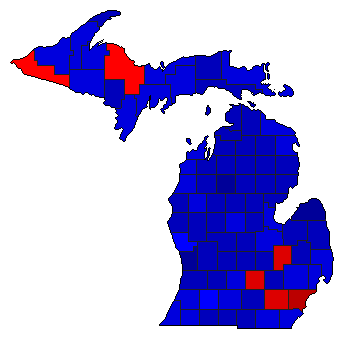
 |  | Governor |
3,156,531 |
2 |
1 |
0 |
128,342 |
4.07% |
46.86% |
50.92% |
0.00% |
2.22% |
1,479,057 |
1,607,399 |
0 |
70,075 |
 | | Secretary of State |
3,080,795 |
2 |
1 |
3 |
326,043 |
10.58% |
42.94% |
53.53% |
1.98% |
1.55% |
1,323,004 |
1,649,047 |
61,112 |
47,632 |
 | | Attorney General |
3,077,164 |
2 |
1 |
3 |
243,632 |
7.92% |
44.19% |
52.11% |
1.86% |
1.84% |
1,359,839 |
1,603,471 |
57,345 |
56,509 |
| | | Map | Pie | Initiative | Total Vote | N | | Y | Margin | %Margin | No | | Yes | Oth. | No | | Yes | |
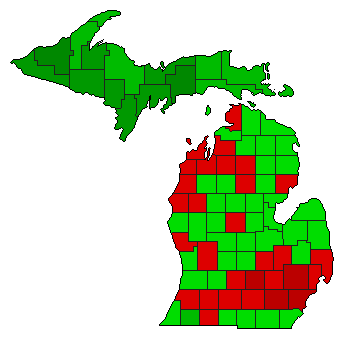 | | Referendum |
2,924,408 |
1 |
0 |
2 |
288,248 |
9.86% |
54.93% |
0.00% |
45.07% |
0.00% |
1,606,328 |
0 |
1,318,080 |
0 |
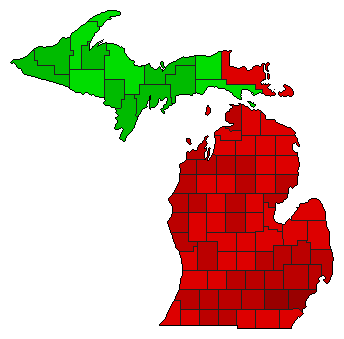 | | Referendum |
2,908,029 |
1 |
0 |
2 |
805,177 |
27.69% |
63.84% |
0.00% |
36.16% |
0.00% |
1,856,603 |
0 |
1,051,426 |
0 |
|
