| Map | Pie | Office | Total | D | R | I | Margin | %Margin | Dem | Rep | Ind | Oth. | Dem | Rep | Ind | Other | | | | | | | | | | | | | | | | | | |
|---|
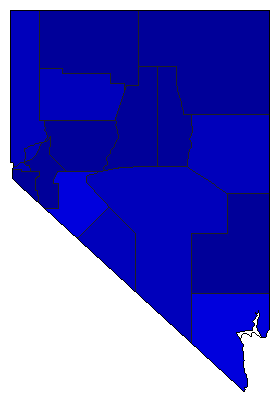
 |  | Governor |
547,349 |
2 |
1 |
0 |
255,618 |
46.70% |
23.88% |
70.58% |
0.00% |
5.53% |
130,722 |
386,340 |
0 |
30,287 |
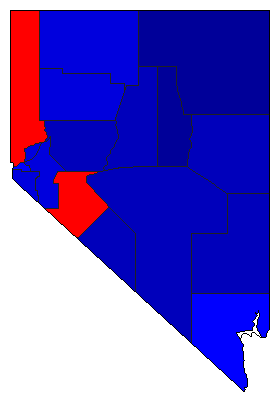
 | | Lt. Governor |
545,534 |
2 |
1 |
3 |
140,873 |
25.82% |
33.65% |
59.47% |
3.89% |
2.99% |
183,571 |
324,444 |
21,221 |
16,298 |
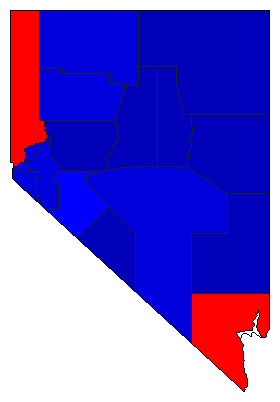
 | | Secretary of State |
543,111 |
2 |
1 |
3 |
23,109 |
4.25% |
46.14% |
50.40% |
3.46% |
0.00% |
250,612 |
273,721 |
18,778 |
0 |
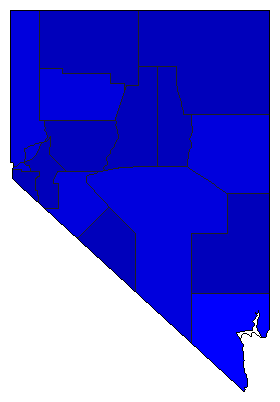
 |  | State Treasurer |
539,214 |
2 |
1 |
0 |
53,700 |
9.96% |
41.50% |
51.45% |
0.00% |
7.05% |
223,750 |
277,450 |
0 |
38,014 |
 | | Attorney General |
544,151 |
2 |
1 |
3 |
4,751 |
0.87% |
45.32% |
46.20% |
5.61% |
2.87% |
246,629 |
251,380 |
30,513 |
15,629 |
 |  | Controller |
538,166 |
2 |
1 |
0 |
80,101 |
14.88% |
37.64% |
52.53% |
0.00% |
9.83% |
202,573 |
282,674 |
0 |
52,919 |
|
