| Map | Pie | Office | Total | D | R | I | Margin | %Margin | Dem | Rep | Ind | Oth. | Dem | Rep | Ind | Other | | | | | | | | | | | | | | | | | | |
|---|
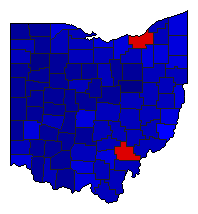
 |  | Governor |
3,055,913 |
2 |
1 |
0 |
935,489 |
30.61% |
33.03% |
63.64% |
0.00% |
3.33% |
1,009,359 |
1,944,848 |
0 |
101,706 |
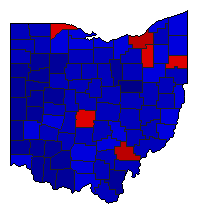
 | | Secretary of State |
3,026,787 |
2 |
1 |
3 |
736,545 |
24.33% |
35.50% |
59.83% |
4.67% |
0.00% |
1,074,475 |
1,811,020 |
141,292 |
0 |
 | | State Treasurer |
3,047,385 |
2 |
1 |
0 |
400,735 |
13.15% |
43.42% |
56.58% |
0.00% |
0.00% |
1,323,325 |
1,724,060 |
0 |
0 |
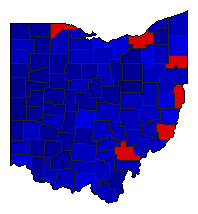 | | Attorney General |
3,060,474 |
2 |
1 |
0 |
703,622 |
22.99% |
38.50% |
61.50% |
0.00% |
0.00% |
1,178,426 |
1,882,048 |
0 |
0 |
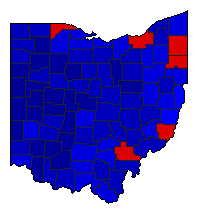 | | State Auditor |
3,004,595 |
2 |
1 |
3 |
562,622 |
18.73% |
38.25% |
56.98% |
4.77% |
0.00% |
1,149,305 |
1,711,927 |
143,363 |
0 |
| | | Map | Pie | Initiative | Total Vote | N | | Y | Margin | %Margin | No | | Yes | Oth. | No | | Yes | |
 | | Referendum |
1,224,480 |
2 |
0 |
1 |
369,934 |
30.21% |
34.89% |
0.00% |
65.11% |
0.00% |
427,273 |
0 |
797,207 |
0 |
|
