| Map | Pie | Office | Total | D | R | I | Margin | %Margin | Dem | Rep | Ind | Oth. | Dem | Rep | Ind | Other | | | | | | | | | | | | | | | | | | |
|---|
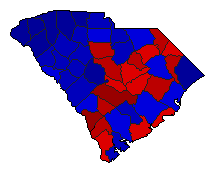
 |  | Senator |
1,240,075 |
2 |
1 |
3 |
192,008 |
15.48% |
38.78% |
54.27% |
3.84% |
3.11% |
480,933 |
672,941 |
47,588 |
38,613 |
 |  | Senator (S) |
1,238,982 |
2 |
1 |
0 |
297,632 |
24.02% |
37.09% |
61.12% |
0.00% |
1.79% |
459,583 |
757,215 |
0 |
22,184 |
 |  | Governor |
1,246,301 |
2 |
1 |
4 |
180,479 |
14.48% |
41.42% |
55.90% |
0.92% |
1.76% |
516,166 |
696,645 |
11,496 |
21,994 |
 | | Lt. Governor |
1,237,142 |
2 |
1 |
0 |
218,014 |
17.62% |
41.13% |
58.75% |
0.00% |
0.12% |
508,807 |
726,821 |
0 |
1,514 |
 | | Secretary of State |
1,227,871 |
2 |
1 |
0 |
234,395 |
19.09% |
40.42% |
59.51% |
0.00% |
0.06% |
496,344 |
730,739 |
0 |
788 |
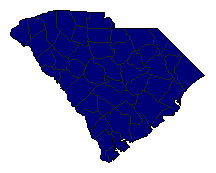 | | State Treasurer |
868,345 |
0 |
1 |
0 |
846,707 |
97.51% |
0.00% |
98.75% |
0.00% |
1.25% |
0 |
857,526 |
0 |
10,819 |
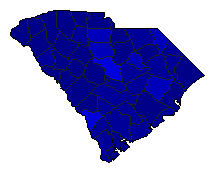
 | | Attorney General |
1,225,371 |
2 |
1 |
0 |
252,376 |
20.60% |
39.67% |
60.26% |
0.00% |
0.07% |
486,058 |
738,434 |
0 |
879 |
 | | Comptroller General |
1,218,308 |
2 |
1 |
0 |
239,483 |
19.66% |
40.14% |
59.80% |
0.00% |
0.06% |
489,066 |
728,549 |
0 |
693 |
 | | Agriculture Commissioner |
953,616 |
0 |
1 |
2 |
653,417 |
68.52% |
0.00% |
79.66% |
11.14% |
9.20% |
0 |
759,640 |
106,223 |
87,753 |
|
