| Map | Pie | Office | Total | D | R | I | Margin | %Margin | Dem | Rep | Ind | Oth. | Dem | Rep | Ind | Other | | | | | | | | | | | | | | | | | | |
|---|
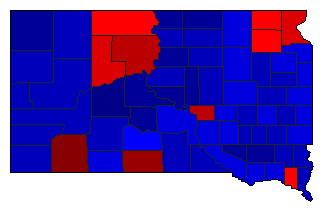
 |  | Senator |
279,412 |
2 |
1 |
3 |
58,285 |
20.86% |
29.51% |
50.37% |
17.09% |
3.03% |
82,456 |
140,741 |
47,741 |
8,474 |
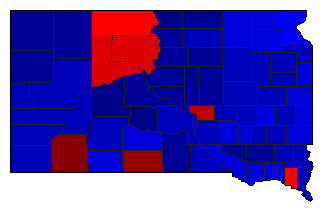
 |  | US Representative |
276,319 |
2 |
1 |
0 |
91,349 |
33.06% |
33.47% |
66.53% |
0.00% |
0.00% |
92,485 |
183,834 |
0 |
0 |
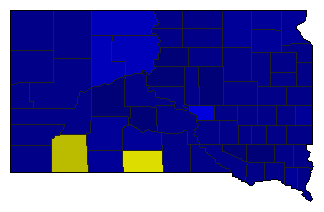
 |  | Governor |
277,403 |
2 |
1 |
3 |
124,928 |
45.03% |
25.43% |
70.47% |
4.10% |
0.00% |
70,549 |
195,477 |
11,377 |
0 |
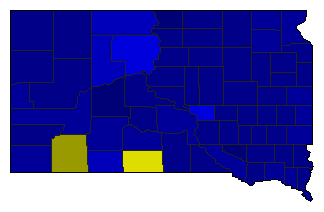
 | | Secretary of State |
258,414 |
2 |
1 |
0 |
71,466 |
27.66% |
32.58% |
60.23% |
0.00% |
7.19% |
84,181 |
155,647 |
0 |
18,586 |
 | | State Treasurer |
254,575 |
2 |
1 |
0 |
70,556 |
27.72% |
33.47% |
61.18% |
0.00% |
5.35% |
85,202 |
155,758 |
0 |
13,615 |
 | | Attorney General |
254,704 |
0 |
1 |
0 |
162,992 |
63.99% |
0.00% |
82.00% |
0.00% |
18.00% |
0 |
208,848 |
0 |
45,856 |
 | | State Auditor |
239,858 |
0 |
1 |
0 |
143,652 |
59.89% |
0.00% |
79.95% |
0.00% |
20.05% |
0 |
191,755 |
0 |
48,103 |
|
