| Map | Pie | Office | Total | D | R | I | Margin | %Margin | Dem | Rep | Ind | Oth. | Dem | Rep | Ind | Other | | | | | | | | | | | | | | | | | | |
|---|
 |  | Senator |
847,505 |
2 |
1 |
0 |
144,645 |
17.07% |
39.43% |
56.50% |
0.00% |
4.07% |
334,174 |
478,819 |
0 |
34,512 |
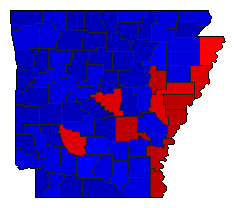
 |  | Governor |
848,592 |
2 |
1 |
0 |
118,314 |
13.94% |
41.49% |
55.44% |
0.00% |
3.07% |
352,115 |
470,429 |
0 |
26,048 |
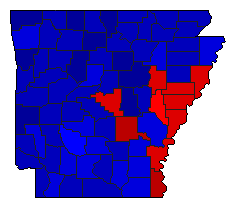
 | | Lt. Governor |
837,377 |
2 |
1 |
0 |
155,113 |
18.52% |
38.64% |
57.16% |
0.00% |
4.20% |
323,548 |
478,661 |
0 |
35,168 |
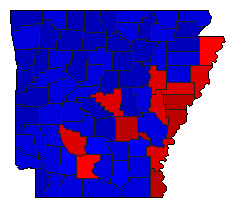
 | | Secretary of State |
833,603 |
2 |
1 |
0 |
213,036 |
25.56% |
35.06% |
60.61% |
0.00% |
4.33% |
292,251 |
505,287 |
0 |
36,065 |
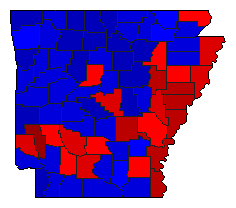
 | | State Treasurer |
826,494 |
2 |
1 |
0 |
157,993 |
19.12% |
37.26% |
56.38% |
0.00% |
6.36% |
307,987 |
465,980 |
0 |
52,527 |
 | | Attorney General |
832,900 |
2 |
1 |
0 |
69,812 |
8.38% |
43.22% |
51.60% |
0.00% |
5.18% |
359,967 |
429,779 |
0 |
43,154 |
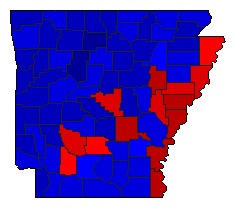 | | State Auditor |
822,424 |
2 |
1 |
0 |
162,611 |
19.77% |
37.40% |
57.17% |
0.00% |
5.42% |
307,607 |
470,218 |
0 |
44,599 |
|