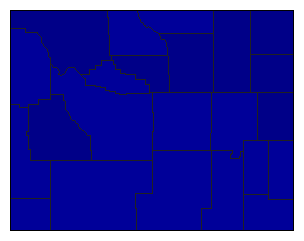
| Map | Pie | Office | Total | D | R | I | Margin | %Margin | Dem | Rep | Ind | Oth. | Dem | Rep | Ind | Other | | | | | | | | | | | | | | | | | | |
|---|
 |  | Senator |
168,390 |
2 |
1 |
3 |
92,177 |
54.74% |
17.45% |
72.19% |
7.90% |
2.46% |
29,377 |
121,554 |
13,311 |
4,148 |
 |  | US Representative |
165,100 |
2 |
1 |
0 |
75,235 |
45.57% |
22.90% |
68.47% |
0.00% |
8.64% |
37,803 |
113,038 |
0 |
14,259 |
 |  | Governor |
167,877 |
2 |
1 |
3 |
53,948 |
32.14% |
27.25% |
59.39% |
5.89% |
7.46% |
45,752 |
99,700 |
9,895 |
12,530 |
 | | Secretary of State |
156,407 |
0 |
1 |
0 |
100,854 |
64.48% |
0.00% |
76.58% |
0.00% |
23.42% |
0 |
119,772 |
0 |
36,635 |
 | | State Treasurer |
140,093 |
0 |
1 |
0 |
137,569 |
98.20% |
0.00% |
99.10% |
0.00% |
0.90% |
0 |
138,831 |
0 |
1,262 |
 | | State Auditor |
139,541 |
0 |
1 |
0 |
136,891 |
98.10% |
0.00% |
99.05% |
0.00% |
0.95% |
0 |
138,216 |
0 |
1,325 |
|