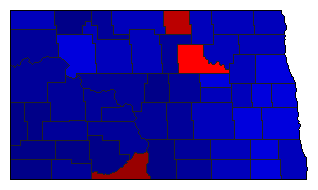
| Map | Pie | Office | Total | D | R | I | Margin | %Margin | Dem | Rep | Ind | Oth. | Dem | Rep | Ind | Other | | | | | | | | | | | | | | | | | | |
|---|
 |  | President |
344,360 |
2 |
1 |
0 |
123,036 |
35.73% |
27.23% |
62.96% |
0.00% |
9.82% |
93,758 |
216,794 |
0 |
33,808 |
 |  | Senator |
342,501 |
2 |
1 |
4 |
210,672 |
61.51% |
16.97% |
78.48% |
1.36% |
3.19% |
58,116 |
268,788 |
4,675 |
10,922 |
 |  | US Representative |
338,459 |
2 |
1 |
0 |
153,603 |
45.38% |
23.75% |
69.13% |
0.00% |
7.12% |
80,377 |
233,980 |
0 |
24,102 |
 |  | Governor |
339,601 |
2 |
1 |
0 |
194,008 |
57.13% |
19.39% |
76.52% |
0.00% |
4.09% |
65,855 |
259,863 |
0 |
13,883 |
 |  | State Treasurer |
325,244 |
2 |
1 |
0 |
109,542 |
33.68% |
29.27% |
62.95% |
0.00% |
7.78% |
95,191 |
204,733 |
0 |
25,320 |
 |  | State Auditor |
308,992 |
0 |
1 |
0 |
165,933 |
53.70% |
0.00% |
76.62% |
0.00% |
23.38% |
0 |
236,751 |
0 |
72,241 |
 |  | Insurance Commissioner |
319,939 |
2 |
1 |
0 |
120,371 |
37.62% |
26.79% |
64.41% |
0.00% |
8.81% |
85,696 |
206,067 |
0 |
28,176 |
|


