| Map | Pie | Office | Total | D | R | I | Margin | %Margin | Dem | Rep | Ind | Oth. | Dem | Rep | Ind | Other | | | | | | | | | | | | | | | | | | |
|---|
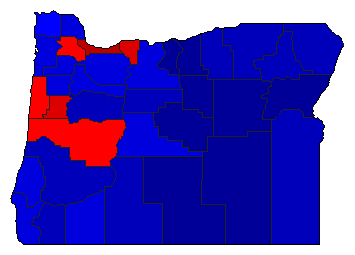
 |  | President |
2,001,336 |
1 |
2 |
0 |
219,703 |
10.98% |
50.07% |
39.09% |
0.00% |
10.83% |
1,002,106 |
782,403 |
0 |
216,827 |
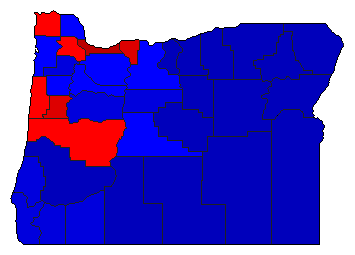
 |  | Senator |
1,952,478 |
1 |
2 |
4 |
454,013 |
23.25% |
56.60% |
33.35% |
3.05% |
7.00% |
1,105,119 |
651,106 |
59,516 |
136,737 |
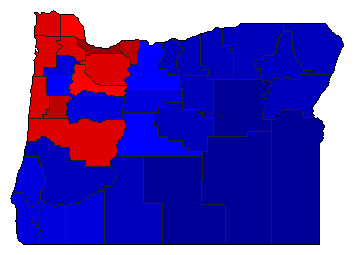
 |  | Governor |
1,946,046 |
1 |
2 |
3 |
139,418 |
7.16% |
50.62% |
43.45% |
2.44% |
3.49% |
985,027 |
845,609 |
47,481 |
67,929 |
 |  | Secretary of State |
1,821,422 |
2 |
1 |
3 |
80,097 |
4.40% |
43.14% |
47.54% |
3.43% |
5.89% |
785,834 |
865,931 |
62,425 |
107,232 |
 |  | State Treasurer |
1,790,920 |
1 |
2 |
3 |
40,464 |
2.26% |
43.92% |
41.66% |
9.43% |
5.00% |
786,551 |
746,087 |
168,797 |
89,485 |
 |  | Attorney General |
1,840,630 |
1 |
2 |
0 |
245,008 |
13.31% |
54.97% |
41.66% |
0.00% |
3.37% |
1,011,761 |
766,753 |
0 |
62,116 |
|
