2012 Presidential Election - Election Results by County
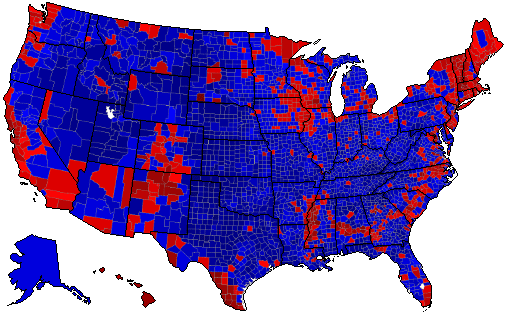 |  |
The map above shows the county results of the 2012 Presidential Election by party, with blue counties representing wins by the Republican candidate and red counties representing wins by the Democratic candidate. Color shading represents the percentage of vote received by the winning candidate as indicated in the key above.
Large Election Results by County Map for 2012 - National Results for 2012
Login
© Dave Leip's Atlas of U.S. Elections, LLC 2019 All Rights Reserved
Note: The advertisement links below may advocate political positions that this site does not endorse.
Login
© Dave Leip's Atlas of U.S. Elections, LLC 2019 All Rights Reserved
Note: The advertisement links below may advocate political positions that this site does not endorse.