1992 Presidential General Election Data Graphs - New Hampshire
by County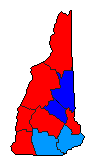
| Belknap | Clinton | 33.5% | |
| Bush | 42.2% | |
| Perot | 23.8% | |
| Other | 0.5% | |
| Carroll | Clinton | 33.4% | |
| Bush | 40.2% | |
| Perot | 25.6% | |
| Other | 0.8% | |
| Cheshire | Clinton | 46.3% | |
| Bush | 34.0% | |
| Perot | 19.1% | |
| Other | 0.6% | |
| Coos | Clinton | 41.5% | |
| Bush | 33.4% | |
| Perot | 24.5% | |
| Other | 0.7% | |
| Grafton | Clinton | 42.3% | |
| Bush | 37.0% | |
| Perot | 20.1% | |
| Other | 0.6% | |
| Hillsborough | Clinton | 37.0% | |
| Bush | 39.0% | |
| Perot | 22.9% | |
| Other | 1.1% | |
| Merrimack | Clinton | 41.5% | |
| Bush | 37.6% | |
| Perot | 20.2% | |
| Other | 0.7% | |
| Rockingham | Clinton | 35.8% | |
| Bush | 38.2% | |
| Perot | 25.2% | |
| Other | 0.8% | |
| Strafford | Clinton | 44.7% | |
| Bush | 33.7% | |
| Perot | 20.9% | |
| Other | 0.7% | |
| Sullivan | Clinton | 44.5% | |
| Bush | 35.5% | |
| Perot | 19.2% | |
| Other | 0.8% | |