1996 Presidential General Election Data Graphs - Wisconsin
by County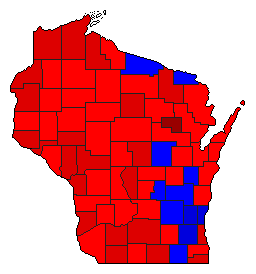
| Adams | Clinton | 52.6% | |
| Dole | 31.3% | |
| Perot | 14.3% | |
| Other | 1.7% | |
| Ashland | Clinton | 56.0% | |
| Dole | 27.4% | |
| Perot | 12.7% | |
| Other | 3.9% | |
| Barron | Clinton | 46.7% | |
| Dole | 35.8% | |
| Perot | 15.7% | |
| Other | 1.8% | |
| Bayfield | Clinton | 53.1% | |
| Dole | 30.7% | |
| Perot | 12.2% | |
| Other | 4.0% | |
| Brown | Clinton | 47.1% | |
| Dole | 42.5% | |
| Perot | 8.8% | |
| Other | 1.6% | |
| Buffalo | Clinton | 48.2% | |
| Dole | 32.4% | |
| Perot | 17.5% | |
| Other | 1.9% | |
| Burnett | Clinton | 50.6% | |
| Dole | 34.2% | |
| Perot | 13.4% | |
| Other | 1.8% | |
| Calumet | Clinton | 42.6% | |
| Dole | 43.2% | |
| Perot | 13.0% | |
| Other | 1.2% | |
| Chippewa | Clinton | 45.7% | |
| Dole | 35.6% | |
| Perot | 16.9% | |
| Other | 1.9% | |
| Clark | Clinton | 43.1% | |
| Dole | 35.9% | |
| Perot | 19.3% | |
| Other | 1.7% | |
| Columbia | Clinton | 48.0% | |
| Dole | 38.9% | |
| Perot | 11.0% | |
| Other | 2.0% | |
| Crawford | Clinton | 51.8% | |
| Dole | 30.4% | |
| Perot | 15.0% | |
| Other | 2.7% | |
| Dane | Clinton | 56.9% | |
| Dole | 30.9% | |
| Perot | 6.5% | |
| Other | 5.7% | |
| Dodge | Clinton | 42.9% | |
| Dole | 43.8% | |
| Perot | 11.3% | |
| Other | 2.0% | |
| Door | Clinton | 45.6% | |
| Dole | 40.4% | |
| Perot | 12.0% | |
| Other | 1.9% | |
| Douglas | Clinton | 59.0% | |
| Dole | 27.8% | |
| Perot | 10.8% | |
| Other | 2.4% | |
| Dunn | Clinton | 48.9% | |
| Dole | 31.9% | |
| Perot | 16.6% | |
| Other | 2.6% | |
| Eau Claire | Clinton | 50.3% | |
| Dole | 34.4% | |
| Perot | 12.8% | |
| Other | 2.6% | |
| Florence | Clinton | 40.6% | |
| Dole | 43.3% | |
| Perot | 14.8% | |
| Other | 1.4% | |
| Fond du Lac | Clinton | 42.1% | |
| Dole | 44.6% | |
| Perot | 11.4% | |
| Other | 1.9% | |
| Forest | Clinton | 52.8% | |
| Dole | 29.4% | |
| Perot | 17.1% | |
| Other | 0.7% | |
| Grant | Clinton | 47.9% | |
| Dole | 36.5% | |
| Perot | 13.8% | |
| Other | 1.8% | |
| Green | Clinton | 48.6% | |
| Dole | 37.2% | |
| Perot | 12.2% | |
| Other | 2.0% | |
| Green Lake | Clinton | 40.0% | |
| Dole | 45.2% | |
| Perot | 13.0% | |
| Other | 1.8% | |
| Iowa | Clinton | 52.6% | |
| Dole | 32.1% | |
| Perot | 12.0% | |
| Other | 3.2% | |
| Iron | Clinton | 48.9% | |
| Dole | 35.7% | |
| Perot | 13.3% | |
| Other | 2.2% | |
| Jackson | Clinton | 50.9% | |
| Dole | 31.1% | |
| Perot | 16.0% | |
| Other | 2.0% | |
| Jefferson | Clinton | 44.3% | |
| Dole | 42.6% | |
| Perot | 10.7% | |
| Other | 2.4% | |
| Juneau | Clinton | 47.2% | |
| Dole | 35.1% | |
| Perot | 15.2% | |
| Other | 2.5% | |
| Kenosha | Clinton | 52.1% | |
| Dole | 34.1% | |
| Perot | 12.1% | |
| Other | 1.8% | |
| Kewaunee | Clinton | 47.7% | |
| Dole | 37.9% | |
| Perot | 12.8% | |
| Other | 1.6% | |
| La Crosse | Clinton | 51.4% | |
| Dole | 35.8% | |
| Perot | 10.5% | |
| Other | 2.2% | |
| Lafayette | Clinton | 50.5% | |
| Dole | 33.6% | |
| Perot | 14.6% | |
| Other | 1.3% | |
| Langlade | Clinton | 47.2% | |
| Dole | 37.1% | |
| Perot | 14.5% | |
| Other | 1.2% | |
| Lincoln | Clinton | 50.4% | |
| Dole | 33.3% | |
| Perot | 14.7% | |
| Other | 1.7% | |
| Manitowoc | Clinton | 48.6% | |
| Dole | 38.4% | |
| Perot | 11.4% | |
| Other | 1.5% | |
| Marathon | Clinton | 46.7% | |
| Dole | 38.6% | |
| Perot | 13.1% | |
| Other | 1.6% | |
| Marinette | Clinton | 46.2% | |
| Dole | 39.7% | |
| Perot | 13.0% | |
| Other | 1.1% | |
| Marquette | Clinton | 46.7% | |
| Dole | 36.1% | |
| Perot | 15.0% | |
| Other | 2.2% | |
| Menominee | Clinton | 73.5% | |
| Dole | 17.0% | |
| Perot | 7.9% | |
| Other | 1.6% | |
| Milwaukee | Clinton | 58.3% | |
| Dole | 32.2% | |
| Perot | 7.0% | |
| Other | 2.5% | |
| Monroe | Clinton | 47.4% | |
| Dole | 36.3% | |
| Perot | 14.3% | |
| Other | 2.0% | |
| Oconto | Clinton | 48.4% | |
| Dole | 38.8% | |
| Perot | 11.9% | |
| Other | 0.8% | |
| Oneida | Clinton | 45.0% | |
| Dole | 37.5% | |
| Perot | 15.4% | |
| Other | 2.1% | |
| Outagamie | Clinton | 44.4% | |
| Dole | 42.8% | |
| Perot | 11.1% | |
| Other | 1.7% | |
| Ozaukee | Clinton | 34.1% | |
| Dole | 56.7% | |
| Perot | 7.1% | |
| Other | 2.2% | |
| Pepin | Clinton | 51.2% | |
| Dole | 32.6% | |
| Perot | 14.7% | |
| Other | 1.5% | |
| Pierce | Clinton | 53.1% | |
| Dole | 30.7% | |
| Perot | 13.8% | |
| Other | 2.4% | |
| Polk | Clinton | 50.8% | |
| Dole | 32.8% | |
| Perot | 14.4% | |
| Other | 2.0% | |
| Portage | Clinton | 53.1% | |
| Dole | 32.2% | |
| Perot | 11.4% | |
| Other | 3.3% | |
| Price | Clinton | 47.7% | |
| Dole | 34.4% | |
| Perot | 16.5% | |
| Other | 1.4% | |
| Racine | Clinton | 49.7% | |
| Dole | 38.8% | |
| Perot | 9.8% | |
| Other | 1.7% | |
| Richland | Clinton | 48.5% | |
| Dole | 36.6% | |
| Perot | 12.5% | |
| Other | 2.5% | |
| Rock | Clinton | 53.8% | |
| Dole | 33.3% | |
| Perot | 11.3% | |
| Other | 1.6% | |
| Rusk | Clinton | 44.3% | |
| Dole | 33.4% | |
| Perot | 20.0% | |
| Other | 2.3% | |
| St. Croix | Clinton | 49.0% | |
| Dole | 35.6% | |
| Perot | 13.7% | |
| Other | 1.7% | |
| Sauk | Clinton | 48.8% | |
| Dole | 36.7% | |
| Perot | 12.1% | |
| Other | 2.5% | |
| Sawyer | Clinton | 42.8% | |
| Dole | 40.2% | |
| Perot | 14.9% | |
| Other | 2.1% | |
| Shawano | Clinton | 44.2% | |
| Dole | 41.3% | |
| Perot | 13.4% | |
| Other | 1.2% | |
| Sheboygan | Clinton | 46.9% | |
| Dole | 42.7% | |
| Perot | 8.8% | |
| Other | 1.6% | |
| Taylor | Clinton | 41.0% | |
| Dole | 39.2% | |
| Perot | 18.4% | |
| Other | 1.4% | |
| Trempealeau | Clinton | 54.2% | |
| Dole | 28.1% | |
| Perot | 15.6% | |
| Other | 2.1% | |
| Vernon | Clinton | 49.6% | |
| Dole | 33.8% | |
| Perot | 13.6% | |
| Other | 3.0% | |
| Vilas | Clinton | 40.5% | |
| Dole | 43.0% | |
| Perot | 14.8% | |
| Other | 1.7% | |
| Walworth | Clinton | 40.3% | |
| Dole | 45.8% | |
| Perot | 11.3% | |
| Other | 2.6% | |
| Washburn | Clinton | 46.2% | |
| Dole | 38.6% | |
| Perot | 13.2% | |
| Other | 2.0% | |
| Washington | Clinton | 35.2% | |
| Dole | 53.0% | |
| Perot | 9.8% | |
| Other | 2.0% | |
| Waukesha | Clinton | 34.7% | |
| Dole | 55.4% | |
| Perot | 7.9% | |
| Other | 2.0% | |
| Waupaca | Clinton | 40.5% | |
| Dole | 45.1% | |
| Perot | 12.8% | |
| Other | 1.6% | |
| Waushara | Clinton | 43.3% | |
| Dole | 40.5% | |
| Perot | 14.3% | |
| Other | 1.9% | |
| Winnebago | Clinton | 45.3% | |
| Dole | 42.7% | |
| Perot | 10.0% | |
| Other | 1.9% | |
| Wood | Clinton | 45.1% | |
| Dole | 39.0% | |
| Perot | 14.2% | |
| Other | 1.8% | |