1972 Presidential General Election Data Graphs - Florida
Note: The Google advertisement links below may advocate political positions that this site does not endorse.
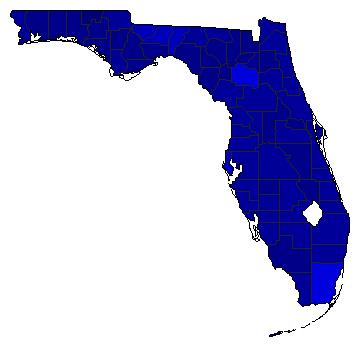
Map

AlachuaMcGovern43.3%
 
Nixon56.5%
 
Other0.2%


BakerMcGovern16.3%
 
Nixon83.6%
 
Other0.0%


BayMcGovern16.2%
 
Nixon83.8%


BradfordMcGovern24.6%
 
Nixon73.7%
 
Other1.8%


BrevardMcGovern21.1%
 
Nixon78.7%
 
Other0.1%


BrowardMcGovern27.3%
 
Nixon72.4%
 
Other0.3%


CalhounMcGovern18.2%
 
Nixon81.7%
 
Other0.1%


CharlotteMcGovern23.0%
 
Nixon76.6%
 
Other0.3%


CitrusMcGovern22.8%
 
Nixon77.2%
 
Other0.0%


ClayMcGovern14.3%
 
Nixon85.5%
 
Other0.2%


CollierMcGovern19.1%
 
Nixon80.6%
 
Other0.3%


ColumbiaMcGovern19.8%
 
Nixon80.2%


DesotoMcGovern22.3%
 
Nixon77.6%
 
Other0.1%


DixieMcGovern18.4%
 
Nixon81.5%
 
Other0.1%


DuvalMcGovern27.5%
 
Nixon72.2%
 
Other0.3%


EscambiaMcGovern20.0%
 
Nixon79.6%
 
Other0.4%


FlaglerMcGovern25.9%
 
Nixon74.1%


FranklinMcGovern17.7%
 
Nixon82.1%
 
Other0.2%


GadsdenMcGovern39.0%
 
Nixon61.0%
 
Other0.0%


GilchristMcGovern15.8%
 
Nixon83.5%
 
Other0.8%


GladesMcGovern19.6%
 
Nixon78.8%
 
Other1.6%


GulfMcGovern21.3%
 
Nixon78.5%
 
Other0.1%


HamiltonMcGovern26.4%
 
Nixon73.3%
 
Other0.3%


HardeeMcGovern15.4%
 
Nixon84.6%
 
Other0.1%


HendryMcGovern21.1%
 
Nixon78.9%
 
Other0.1%


HernandoMcGovern25.1%
 
Nixon74.9%
 
Other0.0%


HighlandsMcGovern20.3%
 
Nixon79.5%
 
Other0.2%


HillsboroughMcGovern29.7%
 
Nixon70.1%
 
Other0.2%


HolmesMcGovern7.5%
 
Nixon92.5%


Indian RiverMcGovern22.0%
 
Nixon77.8%
 
Other0.2%


JacksonMcGovern19.9%
 
Nixon80.0%
 
Other0.1%


JeffersonMcGovern32.9%
 
Nixon66.0%
 
Other1.1%


LafayetteMcGovern14.0%
 
Nixon85.7%
 
Other0.3%


LakeMcGovern17.2%
 
Nixon82.6%
 
Other0.2%


LeeMcGovern20.3%
 
Nixon79.5%
 
Other0.2%


LeonMcGovern36.1%
 
Nixon63.7%
 
Other0.2%


LevyMcGovern20.8%
 
Nixon79.1%
 
Other0.0%


LibertyMcGovern15.6%
 
Nixon84.4%


MadisonMcGovern26.7%
 
Nixon72.9%
 
Other0.3%


ManateeMcGovern19.7%
 
Nixon79.8%
 
Other0.5%


MarionMcGovern21.6%
 
Nixon78.2%
 
Other0.2%


MartinMcGovern20.6%
 
Nixon78.8%
 
Other0.6%


DadeMcGovern40.8%
 
Nixon58.9%
 
Other0.4%


MonroeMcGovern27.6%
 
Nixon72.2%
 
Other0.2%


NassauMcGovern20.2%
 
Nixon79.4%
 
Other0.3%


OkaloosaMcGovern10.8%
 
Nixon88.6%
 
Other0.5%


OkeechobeeMcGovern19.4%
 
Nixon80.6%
 
Other0.0%


OrangeMcGovern20.1%
 
Nixon79.6%
 
Other0.4%


OsceolaMcGovern16.7%
 
Nixon82.9%
 
Other0.4%


Palm BeachMcGovern27.2%
 
Nixon72.3%
 
Other0.5%


PascoMcGovern27.9%
 
Nixon71.9%
 
Other0.2%


PinellasMcGovern30.0%
 
Nixon69.8%
 
Other0.1%


PolkMcGovern21.2%
 
Nixon78.4%
 
Other0.4%


PutnamMcGovern24.8%
 
Nixon74.6%
 
Other0.6%


St. JohnsMcGovern22.1%
 
Nixon77.5%
 
Other0.4%


St. LucieMcGovern24.3%
 
Nixon75.4%
 
Other0.3%


Santa RosaMcGovern10.5%
 
Nixon88.9%
 
Other0.6%


SarasotaMcGovern20.0%
 
Nixon80.0%
 
Other0.1%


SeminoleMcGovern19.0%
 
Nixon80.8%
 
Other0.1%


SumterMcGovern23.0%
 
Nixon76.7%
 
Other0.3%


SuwanneeMcGovern18.7%
 
Nixon80.8%
 
Other0.5%


TaylorMcGovern15.5%
 
Nixon84.5%


UnionMcGovern16.1%
 
Nixon83.9%


VolusiaMcGovern29.0%
 
Nixon70.6%
 
Other0.4%


WakullaMcGovern17.9%
 
Nixon82.0%
 
Other0.1%


WaltonMcGovern13.7%
 
Nixon85.9%
 
Other0.4%


WashingtonMcGovern13.8%
 
Nixon86.1%
 
Other0.1%


National DataGraph for 1972 - Florida Results for 1972

Login

Terms of Use - DCMA Policy - Privacy Policy and Cookies


© Dave Leip's Atlas of U.S. Elections, LLC 2019 All Rights Reserved