1972 Presidential General Election Data Graphs - Nevada
by County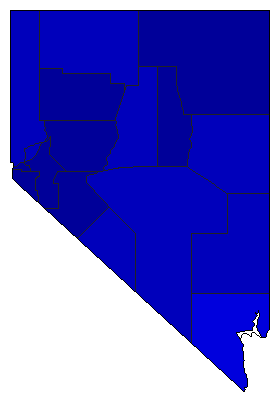
| Churchill | McGovern | 25.9% | |
| Nixon | 74.1% | |
| Clark | McGovern | 40.9% | |
| Nixon | 59.1% | |
| Douglas | McGovern | 25.3% | |
| Nixon | 74.7% | |
| Elko | McGovern | 27.4% | |
| Nixon | 72.6% | |
| Esmeralda | McGovern | 31.8% | |
| Nixon | 68.3% | |
| Eureka | McGovern | 27.3% | |
| Nixon | 72.7% | |
| Humboldt | McGovern | 30.1% | |
| Nixon | 69.9% | |
| Lander | McGovern | 37.0% | |
| Nixon | 63.0% | |
| Lincoln | McGovern | 31.2% | |
| Nixon | 68.8% | |
| Lyon | McGovern | 25.4% | |
| Nixon | 74.6% | |
| Mineral | McGovern | 26.7% | |
| Nixon | 73.3% | |
| Nye | McGovern | 38.4% | |
| Nixon | 61.6% | |
| Pershing | McGovern | 30.0% | |
| Nixon | 70.0% | |
| Storey | McGovern | 30.8% | |
| Nixon | 69.2% | |
| Washoe | McGovern | 33.8% | |
| Nixon | 66.2% | |
| White Pine | McGovern | 38.7% | |
| Nixon | 61.3% | |
City| Carson City | McGovern | 28.2% | |
| Nixon | 71.8% | |