1972 Attorney General General Election Data Graphs - Washington
Note: The Google advertisement links below may advocate political positions that this site does not endorse.
Data for this Contest was Contributed by on 2007-01-03
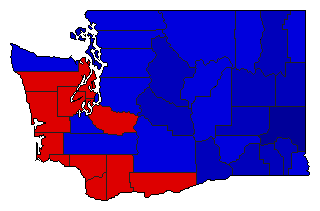
Map

AdamsDore31.9%
 
Gorton68.1%


AsotinDore45.3%
 
Gorton54.7%


BentonDore39.7%
 
Gorton60.3%


ChelanDore38.4%
 
Gorton61.6%


ClallamDore46.0%
 
Gorton54.0%


ClarkDore52.7%
 
Gorton47.3%


ColumbiaDore35.4%
 
Gorton64.6%


CowlitzDore50.7%
 
Gorton49.3%


DouglasDore40.5%
 
Gorton59.5%


FerryDore46.7%
 
Gorton53.3%


FranklinDore45.6%
 
Gorton54.4%


GarfieldDore34.0%
 
Gorton66.0%


GrantDore43.2%
 
Gorton56.8%


Grays HarborDore59.2%
 
Gorton40.8%


IslandDore39.8%
 
Gorton60.2%


JeffersonDore52.1%
 
Gorton47.9%


KingDore43.9%
 
Gorton56.1%


KitsapDore52.7%
 
Gorton47.3%


KittitasDore40.0%
 
Gorton60.0%


KlickitatDore51.5%
 
Gorton48.5%


LewisDore49.0%
 
Gorton51.0%


LincolnDore34.7%
 
Gorton65.3%


MasonDore51.6%
 
Gorton48.4%


OkanoganDore42.9%
 
Gorton57.1%


PacificDore58.4%
 
Gorton41.6%


Pend OreilleDore43.2%
 
Gorton56.8%


PierceDore54.1%
 
Gorton45.9%


San JuanDore30.3%
 
Gorton69.7%


SkagitDore48.0%
 
Gorton52.0%


SkamaniaDore57.2%
 
Gorton42.8%


SnohomishDore49.8%
 
Gorton50.2%


SpokaneDore39.5%
 
Gorton60.5%


StevensDore37.5%
 
Gorton62.5%


ThurstonDore46.5%
 
Gorton53.5%


WahkiakumDore53.1%
 
Gorton46.9%


Walla WallaDore35.5%
 
Gorton64.5%


WhatcomDore42.0%
 
Gorton58.0%


WhitmanDore25.7%
 
Gorton74.3%


YakimaDore42.5%
 
Gorton57.5%


National DataGraph for 1972 - Washington Results for 1972

Login

Terms of Use - DCMA Policy - Privacy Policy and Cookies


© Dave Leip's Atlas of U.S. Elections, LLC 2019 All Rights Reserved