1976 Presidential General Election Data Graphs - Illinois
Note: The Google advertisement links below may advocate political positions that this site does not endorse.
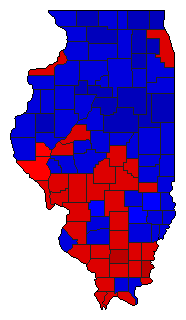
Map

AdamsCarter39.1%
 
Ford59.7%
 
Other1.2%


AlexanderCarter57.4%
 
Ford41.5%
 
Other1.1%


BondCarter49.2%
 
Ford49.7%
 
Other1.1%


BooneCarter40.2%
 
Ford58.4%
 
Other1.4%


BrownCarter49.4%
 
Ford49.0%
 
Other1.6%


BureauCarter40.6%
 
Ford58.2%
 
Other1.2%


CalhounCarter52.6%
 
Ford46.3%
 
Other1.0%


CarrollCarter39.5%
 
Ford59.3%
 
Other1.1%


CassCarter50.2%
 
Ford49.3%
 
Other0.4%


ChampaignCarter42.6%
 
Ford54.7%
 
Other2.7%


ChristianCarter54.9%
 
Ford43.9%
 
Other1.2%


ClarkCarter47.2%
 
Ford52.3%
 
Other0.5%


ClayCarter49.6%
 
Ford49.9%
 
Other0.4%


ClintonCarter45.9%
 
Ford53.0%
 
Other1.1%


ColesCarter42.8%
 
Ford54.7%
 
Other2.5%


CookCarter53.4%
 
Ford44.7%
 
Other1.9%


CrawfordCarter47.1%
 
Ford52.0%
 
Other0.9%


CumberlandCarter51.5%
 
Ford47.1%
 
Other1.4%


DeKalbCarter37.5%
 
Ford59.2%
 
Other3.3%


De WittCarter45.4%
 
Ford54.0%
 
Other0.7%


DouglasCarter44.9%
 
Ford54.4%
 
Other0.7%


DuPageCarter28.3%
 
Ford68.8%
 
Other2.9%


EdgarCarter45.9%
 
Ford53.0%
 
Other1.1%


EdwardsCarter40.5%
 
Ford58.5%
 
Other1.0%


EffinghamCarter44.4%
 
Ford53.7%
 
Other1.8%


FayetteCarter50.0%
 
Ford49.3%
 
Other0.7%


FordCarter35.6%
 
Ford63.6%
 
Other0.8%


FranklinCarter63.1%
 
Ford36.5%
 
Other0.4%


FultonCarter48.8%
 
Ford50.2%
 
Other1.0%


GallatinCarter63.3%
 
Ford36.4%
 
Other0.3%


GreeneCarter51.8%
 
Ford47.3%
 
Other0.8%


GrundyCarter41.9%
 
Ford57.4%
 
Other0.7%


HamiltonCarter55.2%
 
Ford44.3%
 
Other0.5%


HancockCarter43.5%
 
Ford55.5%
 
Other1.0%


HardinCarter53.1%
 
Ford46.2%
 
Other0.7%


HendersonCarter48.8%
 
Ford50.1%
 
Other1.0%


HenryCarter42.8%
 
Ford56.0%
 
Other1.1%


IroquoisCarter33.4%
 
Ford65.4%
 
Other1.2%


JacksonCarter53.6%
 
Ford42.1%
 
Other4.3%


JasperCarter49.1%
 
Ford49.5%
 
Other1.5%


JeffersonCarter54.4%
 
Ford44.9%
 
Other0.7%


JerseyCarter51.5%
 
Ford47.6%
 
Other0.9%


Jo DaviessCarter41.3%
 
Ford56.9%
 
Other1.8%


JohnsonCarter47.1%
 
Ford52.2%
 
Other0.6%


KaneCarter35.7%
 
Ford62.2%
 
Other2.1%


KankakeeCarter43.7%
 
Ford54.6%
 
Other1.7%


KendallCarter31.5%
 
Ford67.5%
 
Other1.0%


KnoxCarter44.4%
 
Ford54.4%
 
Other1.2%


LakeCarter37.8%
 
Ford60.3%
 
Other1.9%


LaSalleCarter47.3%
 
Ford51.4%
 
Other1.3%


LawrenceCarter47.9%
 
Ford51.5%
 
Other0.6%


LeeCarter40.3%
 
Ford57.5%
 
Other2.2%


LivingstonCarter33.1%
 
Ford64.6%
 
Other2.4%


LoganCarter39.5%
 
Ford59.9%
 
Other0.5%


McDonoughCarter35.2%
 
Ford62.3%
 
Other2.5%


McHenryCarter30.5%
 
Ford67.5%
 
Other2.0%


McLeanCarter36.2%
 
Ford62.1%
 
Other1.7%


MaconCarter52.7%
 
Ford46.4%
 
Other0.9%


MacoupinCarter53.0%
 
Ford45.5%
 
Other1.5%


MadisonCarter55.4%
 
Ford43.3%
 
Other1.3%


MarionCarter52.5%
 
Ford46.6%
 
Other0.8%


MarshallCarter38.6%
 
Ford60.3%
 
Other1.1%


MasonCarter50.3%
 
Ford49.0%
 
Other0.7%


MassacCarter52.8%
 
Ford46.5%
 
Other0.6%


MenardCarter42.0%
 
Ford57.3%
 
Other0.7%


MercerCarter45.5%
 
Ford53.6%
 
Other0.8%


MonroeCarter41.0%
 
Ford57.7%
 
Other1.3%


MontgomeryCarter52.5%
 
Ford46.6%
 
Other0.9%


MorganCarter44.9%
 
Ford53.9%
 
Other1.2%


MoultrieCarter54.0%
 
Ford45.4%
 
Other0.6%


OgleCarter36.3%
 
Ford62.2%
 
Other1.5%


PeoriaCarter42.1%
 
Ford56.7%
 
Other1.2%


PerryCarter52.4%
 
Ford46.4%
 
Other1.2%


PiattCarter43.8%
 
Ford55.4%
 
Other0.9%


PikeCarter49.5%
 
Ford49.2%
 
Other1.3%


PopeCarter47.0%
 
Ford52.2%
 
Other0.8%


PulaskiCarter57.3%
 
Ford42.3%
 
Other0.5%


PutnamCarter45.4%
 
Ford53.1%
 
Other1.5%


RandolphCarter51.0%
 
Ford48.1%
 
Other0.9%


RichlandCarter43.3%
 
Ford55.0%
 
Other1.7%


Rock IslandCarter50.5%
 
Ford47.7%
 
Other1.8%


St. ClairCarter58.6%
 
Ford39.9%
 
Other1.5%


SalineCarter55.4%
 
Ford44.2%
 
Other0.4%


SangamonCarter45.9%
 
Ford52.2%
 
Other1.9%


SchuylerCarter43.1%
 
Ford56.4%
 
Other0.4%


ScottCarter44.1%
 
Ford55.4%
 
Other0.6%


ShelbyCarter53.7%
 
Ford45.5%
 
Other0.8%


StarkCarter33.1%
 
Ford63.3%
 
Other3.5%


StephensonCarter37.6%
 
Ford61.0%
 
Other1.4%


TazewellCarter43.5%
 
Ford55.1%
 
Other1.4%


UnionCarter58.3%
 
Ford41.2%
 
Other0.5%


VermilionCarter47.8%
 
Ford51.2%
 
Other0.9%


WabashCarter44.7%
 
Ford54.4%
 
Other0.9%


WarrenCarter38.8%
 
Ford59.3%
 
Other2.0%


WashingtonCarter41.1%
 
Ford57.2%
 
Other1.7%


WayneCarter44.9%
 
Ford54.4%
 
Other0.7%


WhiteCarter53.4%
 
Ford46.3%
 
Other0.3%


WhitesideCarter43.5%
 
Ford55.3%
 
Other1.1%


WillCarter44.5%
 
Ford53.9%
 
Other1.6%


WilliamsonCarter55.4%
 
Ford43.6%
 
Other1.0%


WinnebagoCarter43.5%
 
Ford54.2%
 
Other2.3%


WoodfordCarter34.7%
 
Ford64.0%
 
Other1.3%


National DataGraph for 1976 - Illinois Results for 1976

Login

Terms of Use - DCMA Policy - Privacy Policy and Cookies


© Dave Leip's Atlas of U.S. Elections, LLC 2019 All Rights Reserved