1976 Presidential General Election Data Graphs - New Mexico
by County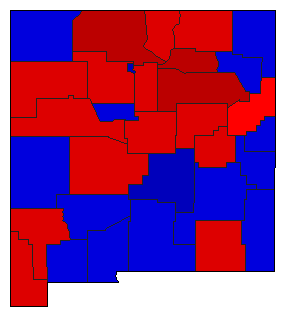
| Bernalillo | Carter | 45.1% | |
| Ford | 54.0% | |
| Other | 1.0% | |
| Catron | Carter | 45.7% | |
| Ford | 53.2% | |
| Other | 1.1% | |
| Chaves | Carter | 39.8% | |
| Ford | 59.3% | |
| Other | 0.9% | |
| Colfax | Carter | 54.3% | |
| Ford | 45.1% | |
| Other | 0.6% | |
| Curry | Carter | 44.1% | |
| Ford | 54.9% | |
| Other | 1.1% | |
| De Baca | Carter | 51.5% | |
| Ford | 47.9% | |
| Other | 0.6% | |
| Dona Ana | Carter | 46.0% | |
| Ford | 53.1% | |
| Other | 0.9% | |
| Eddy | Carter | 53.7% | |
| Ford | 45.6% | |
| Other | 0.7% | |
| Grant | Carter | 55.5% | |
| Ford | 43.9% | |
| Other | 0.6% | |
| Guadalupe | Carter | 56.2% | |
| Ford | 42.7% | |
| Other | 1.1% | |
| Harding | Carter | 42.0% | |
| Ford | 57.1% | |
| Other | 0.9% | |
| Hidalgo | Carter | 51.1% | |
| Ford | 48.6% | |
| Other | 0.3% | |
| Lea | Carter | 42.3% | |
| Ford | 56.8% | |
| Other | 0.9% | |
| Lincoln | Carter | 37.6% | |
| Ford | 61.6% | |
| Other | 0.8% | |
| Los Alamos | Carter | 34.6% | |
| Ford | 64.4% | |
| Other | 1.0% | |
| Luna | Carter | 48.7% | |
| Ford | 50.2% | |
| Other | 1.1% | |
| McKinley | Carter | 59.1% | |
| Ford | 39.8% | |
| Other | 1.0% | |
| Mora | Carter | 60.9% | |
| Ford | 38.3% | |
| Other | 0.8% | |
| Otero | Carter | 47.0% | |
| Ford | 52.1% | |
| Other | 0.9% | |
| Quay | Carter | 49.9% | |
| Ford | 49.1% | |
| Other | 1.0% | |
| Rio Arriba | Carter | 68.2% | |
| Ford | 30.7% | |
| Other | 1.1% | |
| Roosevelt | Carter | 48.4% | |
| Ford | 50.8% | |
| Other | 0.8% | |
| Sandoval | Carter | 54.7% | |
| Ford | 44.3% | |
| Other | 0.9% | |
| San Juan | Carter | 43.8% | |
| Ford | 55.1% | |
| Other | 1.1% | |
| San Miguel | Carter | 61.2% | |
| Ford | 37.2% | |
| Other | 1.7% | |
| Santa Fe | Carter | 54.3% | |
| Ford | 44.5% | |
| Other | 1.1% | |
| Sierra | Carter | 47.9% | |
| Ford | 51.0% | |
| Other | 1.0% | |
| Socorro | Carter | 52.8% | |
| Ford | 45.9% | |
| Other | 1.4% | |
| Taos | Carter | 58.7% | |
| Ford | 40.1% | |
| Other | 1.2% | |
| Torrance | Carter | 50.7% | |
| Ford | 48.5% | |
| Other | 0.8% | |
| Union | Carter | 45.3% | |
| Ford | 53.3% | |
| Other | 1.3% | |
| Valencia | Carter | 51.7% | |
| Ford | 47.4% | |
| Other | 0.8% | |