1976 Presidential General Election Data Graphs - South Carolina
Note: The Google advertisement links below may advocate political positions that this site does not endorse.
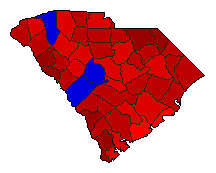
Map

AbbevilleCarter72.1%
 
Ford27.5%
 
Other0.5%


AikenCarter47.9%
 
Ford51.4%
 
Other0.8%


AllendaleCarter71.0%
 
Ford28.7%
 
Other0.3%


AndersonCarter66.3%
 
Ford33.1%
 
Other0.5%


BambergCarter63.8%
 
Ford35.4%
 
Other0.7%


BarnwellCarter61.4%
 
Ford38.6%


BeaufortCarter50.3%
 
Ford49.3%
 
Other0.4%


BerkeleyCarter58.0%
 
Ford41.6%
 
Other0.4%


CalhounCarter59.3%
 
Ford39.9%
 
Other0.8%


CharlestonCarter49.6%
 
Ford49.2%
 
Other1.2%


CherokeeCarter66.2%
 
Ford33.5%
 
Other0.3%


ChesterCarter63.3%
 
Ford36.3%
 
Other0.4%


ChesterfieldCarter75.0%
 
Ford24.8%
 
Other0.2%


ClarendonCarter64.1%
 
Ford35.5%
 
Other0.4%


ColletonCarter60.2%
 
Ford39.0%
 
Other0.8%


DarlingtonCarter60.2%
 
Ford39.5%
 
Other0.3%


DillonCarter66.6%
 
Ford33.1%
 
Other0.3%


DorchesterCarter54.4%
 
Ford45.3%
 
Other0.3%


EdgefieldCarter62.6%
 
Ford36.6%
 
Other0.8%


FairfieldCarter69.4%
 
Ford30.3%
 
Other0.3%


FlorenceCarter54.5%
 
Ford45.3%
 
Other0.2%


GeorgetownCarter63.5%
 
Ford36.0%
 
Other0.5%


GreenvilleCarter47.3%
 
Ford51.5%
 
Other1.2%


GreenwoodCarter62.4%
 
Ford37.4%
 
Other0.3%


HamptonCarter68.6%
 
Ford31.0%
 
Other0.5%


HorryCarter62.6%
 
Ford37.2%
 
Other0.2%


JasperCarter70.1%
 
Ford29.5%
 
Other0.4%


KershawCarter50.1%
 
Ford49.4%
 
Other0.5%


LancasterCarter62.2%
 
Ford37.3%
 
Other0.5%


LaurensCarter58.0%
 
Ford41.3%
 
Other0.7%


LeeCarter61.9%
 
Ford37.7%
 
Other0.4%


LexingtonCarter39.7%
 
Ford59.4%
 
Other0.8%


McCormickCarter73.1%
 
Ford26.4%
 
Other0.5%


MarionCarter65.7%
 
Ford34.1%
 
Other0.1%


MarlboroCarter73.3%
 
Ford26.6%
 
Other0.1%


NewberryCarter50.3%
 
Ford49.2%
 
Other0.5%


OconeeCarter68.6%
 
Ford30.9%
 
Other0.5%


OrangeburgCarter60.4%
 
Ford38.9%
 
Other0.7%


PickensCarter51.1%
 
Ford48.2%
 
Other0.7%


RichlandCarter52.7%
 
Ford46.8%
 
Other0.5%


SaludaCarter56.1%
 
Ford43.1%
 
Other0.8%


SpartanburgCarter57.3%
 
Ford42.0%
 
Other0.7%


SumterCarter52.6%
 
Ford46.9%
 
Other0.5%


UnionCarter64.5%
 
Ford35.1%
 
Other0.4%


WilliamsburgCarter62.2%
 
Ford37.5%
 
Other0.2%


YorkCarter58.7%
 
Ford41.0%
 
Other0.3%


National DataGraph for 1976 - South Carolina Results for 1976

Login

Terms of Use - DCMA Policy - Privacy Policy and Cookies


© Dave Leip's Atlas of U.S. Elections, LLC 2019 All Rights Reserved