1986 Gubernatorial General Election Data Graphs - Pennsylvania
Note: The Google advertisement links below may advocate political positions that this site does not endorse.
Data for this Contest was Contributed by on 2007-10-19
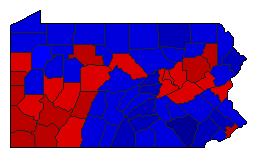
Map

AdamsCasey40.5%
 
Scranton58.4%
 
Other1.1%


AlleghenyCasey56.6%
 
Scranton42.4%
 
Other1.1%


ArmstrongCasey54.8%
 
Scranton44.2%
 
Other1.1%


BeaverCasey66.5%
 
Scranton32.6%
 
Other0.9%


BedfordCasey45.3%
 
Scranton53.9%
 
Other0.8%


BerksCasey44.6%
 
Scranton54.1%
 
Other1.3%


BlairCasey45.8%
 
Scranton53.0%
 
Other1.2%


BradfordCasey37.5%
 
Scranton61.5%
 
Other1.0%


BucksCasey39.6%
 
Scranton59.3%
 
Other1.1%


ButlerCasey46.7%
 
Scranton52.1%
 
Other1.2%


CambriaCasey69.0%
 
Scranton30.2%
 
Other0.8%


CameronCasey46.9%
 
Scranton52.7%
 
Other0.4%


CarbonCasey56.7%
 
Scranton42.4%
 
Other0.9%


CentreCasey42.6%
 
Scranton56.5%
 
Other0.9%


ChesterCasey32.5%
 
Scranton66.6%
 
Other0.9%


ClarionCasey47.7%
 
Scranton51.2%
 
Other1.2%


ClearfieldCasey56.7%
 
Scranton42.7%
 
Other0.7%


ClintonCasey50.5%
 
Scranton48.5%
 
Other1.0%


ColumbiaCasey53.7%
 
Scranton45.7%
 
Other0.6%


CrawfordCasey46.0%
 
Scranton53.2%
 
Other0.8%


CumberlandCasey36.8%
 
Scranton62.5%
 
Other0.7%


DauphinCasey43.3%
 
Scranton56.0%
 
Other0.7%


DelawareCasey39.5%
 
Scranton59.7%
 
Other0.8%


ElkCasey60.4%
 
Scranton38.7%
 
Other0.9%


ErieCasey47.8%
 
Scranton50.3%
 
Other1.9%


FayetteCasey68.7%
 
Scranton30.3%
 
Other1.1%


ForestCasey45.2%
 
Scranton53.8%
 
Other1.0%


FranklinCasey38.8%
 
Scranton60.6%
 
Other0.6%


FultonCasey47.1%
 
Scranton52.2%
 
Other0.7%


GreeneCasey66.1%
 
Scranton33.2%
 
Other0.7%


HuntingdonCasey43.5%
 
Scranton55.6%
 
Other0.9%


IndianaCasey54.6%
 
Scranton44.5%
 
Other0.9%


JeffersonCasey48.8%
 
Scranton50.4%
 
Other0.9%


JuniataCasey44.2%
 
Scranton55.2%
 
Other0.6%


LackawannaCasey67.5%
 
Scranton32.3%
 
Other0.2%


LancasterCasey28.2%
 
Scranton71.0%
 
Other0.8%


LawrenceCasey60.6%
 
Scranton38.4%
 
Other1.0%


LebanonCasey43.1%
 
Scranton56.1%
 
Other0.8%


LehighCasey43.9%
 
Scranton54.9%
 
Other1.1%


LuzerneCasey63.6%
 
Scranton35.8%
 
Other0.6%


LycomingCasey46.8%
 
Scranton52.2%
 
Other1.0%


McKeanCasey39.2%
 
Scranton59.8%
 
Other1.0%


MercerCasey54.8%
 
Scranton44.0%
 
Other1.1%


MifflinCasey44.3%
 
Scranton54.8%
 
Other0.9%


MonroeCasey45.4%
 
Scranton54.0%
 
Other0.6%


MontgomeryCasey33.7%
 
Scranton65.4%
 
Other0.9%


MontourCasey52.6%
 
Scranton47.0%
 
Other0.4%


NorthamptonCasey51.0%
 
Scranton47.9%
 
Other1.1%


NorthumberlandCasey55.9%
 
Scranton43.3%
 
Other0.8%


PerryCasey38.4%
 
Scranton60.4%
 
Other1.3%


PhiladelphiaCasey63.3%
 
Scranton35.6%
 
Other1.1%


PikeCasey39.2%
 
Scranton60.1%
 
Other0.7%


PotterCasey45.6%
 
Scranton53.3%
 
Other1.1%


SchuylkillCasey51.6%
 
Scranton47.5%
 
Other0.9%


SnyderCasey34.1%
 
Scranton64.9%
 
Other1.1%


SomersetCasey54.9%
 
Scranton44.1%
 
Other1.0%


SullivanCasey48.3%
 
Scranton51.1%
 
Other0.5%


SusquehannaCasey43.8%
 
Scranton55.7%
 
Other0.5%


TiogaCasey42.6%
 
Scranton56.3%
 
Other1.1%


UnionCasey36.1%
 
Scranton62.7%
 
Other1.2%


VenangoCasey49.3%
 
Scranton49.6%
 
Other1.2%


WarrenCasey41.6%
 
Scranton57.4%
 
Other1.0%


WashingtonCasey61.3%
 
Scranton37.9%
 
Other0.8%


WayneCasey45.7%
 
Scranton53.5%
 
Other0.9%


WestmorelandCasey60.3%
 
Scranton38.7%
 
Other1.0%


WyomingCasey46.9%
 
Scranton52.4%
 
Other0.8%


YorkCasey39.4%
 
Scranton59.5%
 
Other1.0%


National DataGraph for 1986 - Pennsylvania Results for 1986

Login

Terms of Use - DCMA Policy - Privacy Policy and Cookies


© Dave Leip's Atlas of U.S. Elections, LLC 2019 All Rights Reserved