1992 Presidential General Election Data Graphs - Kansas
by County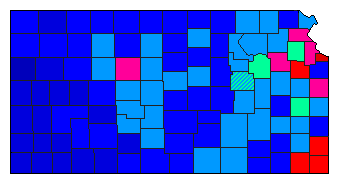
| Allen | Clinton | 36.0% | |
| Bush | 36.6% | |
| Perot | 27.2% | |
| Other | 0.3% | |
| Anderson | Clinton | 32.0% | |
| Bush | 33.0% | |
| Perot | 34.8% | |
| Other | 0.2% | |
| Atchison | Clinton | 39.3% | |
| Bush | 33.5% | |
| Perot | 26.8% | |
| Other | 0.4% | |
| Barber | Clinton | 26.3% | |
| Bush | 42.5% | |
| Perot | 31.0% | |
| Other | 0.1% | |
| Barton | Clinton | 28.3% | |
| Bush | 37.6% | |
| Perot | 33.7% | |
| Other | 0.4% | |
| Bourbon | Clinton | 35.0% | |
| Bush | 40.2% | |
| Perot | 24.6% | |
| Other | 0.2% | |
| Brown | Clinton | 27.9% | |
| Bush | 41.6% | |
| Perot | 30.3% | |
| Other | 0.2% | |
| Butler | Clinton | 29.7% | |
| Bush | 38.8% | |
| Perot | 31.1% | |
| Other | 0.3% | |
| Chase | Clinton | 27.9% | |
| Bush | 36.2% | |
| Perot | 35.6% | |
| Other | 0.3% | |
| Chautauqua | Clinton | 28.8% | |
| Bush | 41.1% | |
| Perot | 29.3% | |
| Other | 0.7% | |
| Cherokee | Clinton | 41.8% | |
| Bush | 36.8% | |
| Perot | 21.2% | |
| Other | 0.2% | |
| Cheyenne | Clinton | 23.2% | |
| Bush | 49.2% | |
| Perot | 27.2% | |
| Other | 0.5% | |
| Clark | Clinton | 22.3% | |
| Bush | 51.5% | |
| Perot | 26.0% | |
| Other | 0.2% | |
| Clay | Clinton | 20.6% | |
| Bush | 47.9% | |
| Perot | 31.2% | |
| Other | 0.2% | |
| Cloud | Clinton | 31.6% | |
| Bush | 39.1% | |
| Perot | 29.0% | |
| Other | 0.3% | |
| Coffey | Clinton | 23.8% | |
| Bush | 42.4% | |
| Perot | 33.6% | |
| Other | 0.2% | |
| Comanche | Clinton | 25.3% | |
| Bush | 49.5% | |
| Perot | 25.2% | |
| Cowley | Clinton | 34.2% | |
| Bush | 34.4% | |
| Perot | 31.1% | |
| Other | 0.3% | |
| Crawford | Clinton | 44.4% | |
| Bush | 33.0% | |
| Perot | 22.3% | |
| Other | 0.3% | |
| Decatur | Clinton | 27.6% | |
| Bush | 45.0% | |
| Perot | 27.0% | |
| Other | 0.4% | |
| Dickinson | Clinton | 27.3% | |
| Bush | 41.8% | |
| Perot | 30.7% | |
| Other | 0.2% | |
| Doniphan | Clinton | 29.6% | |
| Bush | 39.7% | |
| Perot | 30.2% | |
| Other | 0.4% | |
| Douglas | Clinton | 46.0% | |
| Bush | 30.6% | |
| Perot | 22.8% | |
| Other | 0.6% | |
| Edwards | Clinton | 29.5% | |
| Bush | 39.9% | |
| Perot | 30.3% | |
| Other | 0.3% | |
| Elk | Clinton | 27.8% | |
| Bush | 42.9% | |
| Perot | 28.9% | |
| Other | 0.3% | |
| Ellis | Clinton | 36.5% | |
| Bush | 32.0% | |
| Perot | 31.2% | |
| Other | 0.3% | |
| Ellsworth | Clinton | 31.2% | |
| Bush | 37.0% | |
| Perot | 31.5% | |
| Other | 0.4% | |
| Finney | Clinton | 23.9% | |
| Bush | 48.3% | |
| Perot | 27.5% | |
| Other | 0.3% | |
| Ford | Clinton | 25.4% | |
| Bush | 41.9% | |
| Perot | 32.3% | |
| Other | 0.4% | |
| Franklin | Clinton | 30.0% | |
| Bush | 37.4% | |
| Perot | 32.2% | |
| Other | 0.3% | |
| Geary | Clinton | 33.9% | |
| Bush | 38.8% | |
| Perot | 27.2% | |
| Other | 0.2% | |
| Gove | Clinton | 22.2% | |
| Bush | 46.4% | |
| Perot | 31.2% | |
| Other | 0.2% | |
| Graham | Clinton | 29.0% | |
| Bush | 39.3% | |
| Perot | 31.5% | |
| Other | 0.2% | |
| Grant | Clinton | 20.5% | |
| Bush | 51.7% | |
| Perot | 27.7% | |
| Other | 0.1% | |
| Gray | Clinton | 20.4% | |
| Bush | 47.8% | |
| Perot | 31.6% | |
| Other | 0.2% | |
| Greeley | Clinton | 21.9% | |
| Bush | 57.7% | |
| Perot | 20.0% | |
| Other | 0.3% | |
| Greenwood | Clinton | 32.8% | |
| Bush | 36.6% | |
| Perot | 30.3% | |
| Other | 0.3% | |
| Hamilton | Clinton | 28.0% | |
| Bush | 52.0% | |
| Perot | 19.7% | |
| Other | 0.4% | |
| Harper | Clinton | 25.0% | |
| Bush | 40.6% | |
| Perot | 34.1% | |
| Other | 0.3% | |
| Harvey | Clinton | 33.6% | |
| Bush | 41.7% | |
| Perot | 24.3% | |
| Other | 0.3% | |
| Haskell | Clinton | 18.4% | |
| Bush | 56.0% | |
| Perot | 25.3% | |
| Other | 0.3% | |
| Hodgeman | Clinton | 21.0% | |
| Bush | 50.9% | |
| Perot | 27.9% | |
| Other | 0.2% | |
| Jackson | Clinton | 29.5% | |
| Bush | 35.5% | |
| Perot | 34.7% | |
| Other | 0.3% | |
| Jefferson | Clinton | 32.6% | |
| Bush | 33.0% | |
| Perot | 34.0% | |
| Other | 0.4% | |
| Jewell | Clinton | 23.7% | |
| Bush | 45.7% | |
| Perot | 30.3% | |
| Other | 0.3% | |
| Johnson | Clinton | 30.6% | |
| Bush | 43.8% | |
| Perot | 25.2% | |
| Other | 0.4% | |
| Kearny | Clinton | 22.5% | |
| Bush | 55.2% | |
| Perot | 22.0% | |
| Other | 0.4% | |
| Kingman | Clinton | 26.4% | |
| Bush | 40.4% | |
| Perot | 32.9% | |
| Other | 0.3% | |
| Kiowa | Clinton | 18.8% | |
| Bush | 55.9% | |
| Perot | 25.1% | |
| Other | 0.2% | |
| Labette | Clinton | 41.2% | |
| Bush | 33.1% | |
| Perot | 25.3% | |
| Other | 0.4% | |
| Lane | Clinton | 20.4% | |
| Bush | 51.9% | |
| Perot | 27.4% | |
| Other | 0.3% | |
| Leavenworth | Clinton | 34.9% | |
| Bush | 33.4% | |
| Perot | 31.5% | |
| Other | 0.2% | |
| Lincoln | Clinton | 28.2% | |
| Bush | 41.1% | |
| Perot | 30.2% | |
| Other | 0.5% | |
| Linn | Clinton | 32.8% | |
| Bush | 34.2% | |
| Perot | 32.9% | |
| Other | 0.2% | |
| Logan | Clinton | 20.8% | |
| Bush | 53.0% | |
| Perot | 26.1% | |
| Other | 0.2% | |
| Lyon | Clinton | 32.8% | |
| Bush | 34.7% | |
| Perot | 32.2% | |
| Other | 0.3% | |
| McPherson | Clinton | 28.1% | |
| Bush | 44.2% | |
| Perot | 27.4% | |
| Other | 0.3% | |
| Marion | Clinton | 25.6% | |
| Bush | 49.5% | |
| Perot | 24.5% | |
| Other | 0.4% | |
| Marshall | Clinton | 34.5% | |
| Bush | 34.7% | |
| Perot | 30.5% | |
| Other | 0.3% | |
| Meade | Clinton | 19.9% | |
| Bush | 52.4% | |
| Perot | 27.4% | |
| Other | 0.3% | |
| Miami | Clinton | 34.6% | |
| Bush | 31.8% | |
| Perot | 33.4% | |
| Other | 0.3% | |
| Mitchell | Clinton | 25.7% | |
| Bush | 43.9% | |
| Perot | 30.1% | |
| Other | 0.4% | |
| Montgomery | Clinton | 34.3% | |
| Bush | 43.0% | |
| Perot | 22.4% | |
| Other | 0.3% | |
| Morris | Clinton | 30.8% | |
| Bush | 34.4% | |
| Perot | 34.4% | |
| Other | 0.4% | |
| Morton | Clinton | 23.8% | |
| Bush | 54.8% | |
| Perot | 21.0% | |
| Other | 0.4% | |
| Nemaha | Clinton | 28.1% | |
| Bush | 39.5% | |
| Perot | 32.1% | |
| Other | 0.3% | |
| Neosho | Clinton | 35.5% | |
| Bush | 37.1% | |
| Perot | 27.1% | |
| Other | 0.4% | |
| Ness | Clinton | 25.5% | |
| Bush | 43.6% | |
| Perot | 30.6% | |
| Other | 0.4% | |
| Norton | Clinton | 25.4% | |
| Bush | 47.9% | |
| Perot | 26.6% | |
| Other | 0.2% | |
| Osage | Clinton | 31.0% | |
| Bush | 34.5% | |
| Perot | 34.1% | |
| Other | 0.4% | |
| Osborne | Clinton | 29.9% | |
| Bush | 38.5% | |
| Perot | 31.4% | |
| Other | 0.2% | |
| Ottawa | Clinton | 27.1% | |
| Bush | 45.5% | |
| Perot | 27.0% | |
| Other | 0.4% | |
| Pawnee | Clinton | 31.2% | |
| Bush | 37.9% | |
| Perot | 30.6% | |
| Other | 0.4% | |
| Phillips | Clinton | 24.9% | |
| Bush | 46.6% | |
| Perot | 28.2% | |
| Other | 0.3% | |
| Pottawatomie | Clinton | 26.3% | |
| Bush | 38.9% | |
| Perot | 34.5% | |
| Other | 0.3% | |
| Pratt | Clinton | 30.6% | |
| Bush | 37.2% | |
| Perot | 31.9% | |
| Other | 0.3% | |
| Rawlins | Clinton | 20.3% | |
| Bush | 52.9% | |
| Perot | 26.7% | |
| Other | 0.1% | |
| Reno | Clinton | 32.6% | |
| Bush | 40.1% | |
| Perot | 26.9% | |
| Other | 0.4% | |
| Republic | Clinton | 24.7% | |
| Bush | 46.4% | |
| Perot | 28.5% | |
| Other | 0.4% | |
| Rice | Clinton | 29.5% | |
| Bush | 40.9% | |
| Perot | 29.3% | |
| Other | 0.3% | |
| Riley | Clinton | 36.4% | |
| Bush | 38.5% | |
| Perot | 24.7% | |
| Other | 0.4% | |
| Rooks | Clinton | 25.0% | |
| Bush | 40.4% | |
| Perot | 34.4% | |
| Other | 0.2% | |
| Rush | Clinton | 32.6% | |
| Bush | 35.7% | |
| Perot | 31.4% | |
| Other | 0.2% | |
| Russell | Clinton | 29.3% | |
| Bush | 35.7% | |
| Perot | 34.7% | |
| Other | 0.2% | |
| Saline | Clinton | 33.4% | |
| Bush | 36.3% | |
| Perot | 30.1% | |
| Other | 0.3% | |
| Scott | Clinton | 18.9% | |
| Bush | 56.3% | |
| Perot | 24.5% | |
| Other | 0.3% | |
| Sedgwick | Clinton | 33.6% | |
| Bush | 40.5% | |
| Perot | 25.3% | |
| Other | 0.5% | |
| Seward | Clinton | 21.9% | |
| Bush | 51.1% | |
| Perot | 26.7% | |
| Other | 0.3% | |
| Shawnee | Clinton | 38.9% | |
| Bush | 35.7% | |
| Perot | 25.1% | |
| Other | 0.4% | |
| Sheridan | Clinton | 21.2% | |
| Bush | 45.2% | |
| Perot | 33.4% | |
| Other | 0.2% | |
| Sherman | Clinton | 24.7% | |
| Bush | 49.7% | |
| Perot | 25.3% | |
| Other | 0.3% | |
| Smith | Clinton | 27.7% | |
| Bush | 43.3% | |
| Perot | 28.6% | |
| Other | 0.4% | |
| Stafford | Clinton | 28.2% | |
| Bush | 38.6% | |
| Perot | 33.0% | |
| Other | 0.3% | |
| Stanton | Clinton | 22.4% | |
| Bush | 55.7% | |
| Perot | 21.4% | |
| Other | 0.4% | |
| Stevens | Clinton | 15.7% | |
| Bush | 56.8% | |
| Perot | 27.2% | |
| Other | 0.2% | |
| Sumner | Clinton | 30.8% | |
| Bush | 35.3% | |
| Perot | 33.5% | |
| Other | 0.4% | |
| Thomas | Clinton | 23.8% | |
| Bush | 47.1% | |
| Perot | 28.8% | |
| Other | 0.3% | |
| Trego | Clinton | 31.8% | |
| Bush | 38.0% | |
| Perot | 30.0% | |
| Other | 0.2% | |
| Wabaunsee | Clinton | 25.2% | |
| Bush | 37.2% | |
| Perot | 37.3% | |
| Other | 0.3% | |
| Wallace | Clinton | 15.4% | |
| Bush | 63.7% | |
| Perot | 20.5% | |
| Other | 0.4% | |
| Washington | Clinton | 24.1% | |
| Bush | 47.0% | |
| Perot | 28.5% | |
| Other | 0.4% | |
| Wichita | Clinton | 19.6% | |
| Bush | 55.4% | |
| Perot | 24.6% | |
| Other | 0.4% | |
| Wilson | Clinton | 28.7% | |
| Bush | 41.5% | |
| Perot | 29.4% | |
| Other | 0.3% | |
| Woodson | Clinton | 31.6% | |
| Bush | 35.5% | |
| Perot | 32.4% | |
| Other | 0.5% | |
| Wyandotte | Clinton | 56.3% | |
| Bush | 21.1% | |
| Perot | 22.3% | |
| Other | 0.4% | |