1992 Presidential General Election Data Graphs - Washington
by County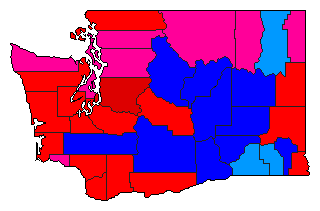
| Adams | Clinton | 31.6% | |
| Bush | 45.5% | |
| Perot | 22.0% | |
| Other | 0.9% | |
| Asotin | Clinton | 42.6% | |
| Bush | 31.9% | |
| Perot | 24.3% | |
| Other | 1.1% | |
| Benton | Clinton | 31.3% | |
| Bush | 43.5% | |
| Perot | 24.5% | |
| Other | 0.7% | |
| Chelan | Clinton | 33.5% | |
| Bush | 45.6% | |
| Perot | 19.6% | |
| Other | 1.3% | |
| Clallam | Clinton | 37.7% | |
| Bush | 34.1% | |
| Perot | 27.1% | |
| Other | 1.1% | |
| Clark | Clinton | 40.0% | |
| Bush | 34.6% | |
| Perot | 24.6% | |
| Other | 0.8% | |
| Columbia | Clinton | 34.9% | |
| Bush | 39.8% | |
| Perot | 24.3% | |
| Other | 1.0% | |
| Cowlitz | Clinton | 43.6% | |
| Bush | 29.0% | |
| Perot | 26.8% | |
| Other | 0.7% | |
| Douglas | Clinton | 33.8% | |
| Bush | 44.5% | |
| Perot | 21.0% | |
| Other | 0.7% | |
| Ferry | Clinton | 37.7% | |
| Bush | 30.2% | |
| Perot | 29.8% | |
| Other | 2.3% | |
| Franklin | Clinton | 34.2% | |
| Bush | 41.0% | |
| Perot | 23.7% | |
| Other | 1.0% | |
| Garfield | Clinton | 35.8% | |
| Bush | 46.9% | |
| Perot | 16.8% | |
| Other | 0.5% | |
| Grant | Clinton | 33.2% | |
| Bush | 43.4% | |
| Perot | 22.3% | |
| Other | 1.1% | |
| Grays Harbor | Clinton | 46.3% | |
| Bush | 25.3% | |
| Perot | 27.4% | |
| Other | 1.0% | |
| Island | Clinton | 35.2% | |
| Bush | 35.1% | |
| Perot | 29.0% | |
| Other | 0.7% | |
| Jefferson | Clinton | 47.5% | |
| Bush | 26.8% | |
| Perot | 24.5% | |
| Other | 1.2% | |
| King | Clinton | 50.2% | |
| Bush | 27.4% | |
| Perot | 21.5% | |
| Other | 0.9% | |
| Kitsap | Clinton | 38.9% | |
| Bush | 33.1% | |
| Perot | 27.0% | |
| Other | 1.0% | |
| Kittitas | Clinton | 43.9% | |
| Bush | 32.9% | |
| Perot | 22.4% | |
| Other | 0.8% | |
| Klickitat | Clinton | 40.3% | |
| Bush | 30.4% | |
| Perot | 28.3% | |
| Other | 1.0% | |
| Lewis | Clinton | 28.7% | |
| Bush | 45.3% | |
| Perot | 24.6% | |
| Other | 1.3% | |
| Lincoln | Clinton | 33.5% | |
| Bush | 43.6% | |
| Perot | 22.2% | |
| Other | 0.7% | |
| Mason | Clinton | 41.1% | |
| Bush | 29.4% | |
| Perot | 28.4% | |
| Other | 1.0% | |
| Okanogan | Clinton | 38.5% | |
| Bush | 32.7% | |
| Perot | 27.2% | |
| Other | 1.6% | |
| Pacific | Clinton | 49.6% | |
| Bush | 24.2% | |
| Perot | 25.4% | |
| Other | 0.8% | |
| Pend Oreille | Clinton | 38.1% | |
| Bush | 32.4% | |
| Perot | 28.4% | |
| Other | 1.1% | |
| Pierce | Clinton | 42.4% | |
| Bush | 32.1% | |
| Perot | 24.7% | |
| Other | 0.8% | |
| San Juan | Clinton | 47.1% | |
| Bush | 26.7% | |
| Perot | 25.0% | |
| Other | 1.2% | |
| Skagit | Clinton | 39.1% | |
| Bush | 32.9% | |
| Perot | 26.9% | |
| Other | 1.1% | |
| Skamania | Clinton | 40.1% | |
| Bush | 29.9% | |
| Perot | 28.5% | |
| Other | 1.5% | |
| Snohomish | Clinton | 39.3% | |
| Bush | 30.7% | |
| Perot | 29.2% | |
| Other | 0.8% | |
| Spokane | Clinton | 41.1% | |
| Bush | 35.5% | |
| Perot | 22.6% | |
| Other | 0.8% | |
| Stevens | Clinton | 33.5% | |
| Bush | 38.6% | |
| Perot | 25.5% | |
| Other | 2.4% | |
| Thurston | Clinton | 45.3% | |
| Bush | 30.3% | |
| Perot | 23.1% | |
| Other | 1.3% | |
| Wahkiakum | Clinton | 38.8% | |
| Bush | 27.2% | |
| Perot | 32.5% | |
| Other | 1.6% | |
| Walla Walla | Clinton | 36.8% | |
| Bush | 39.7% | |
| Perot | 22.7% | |
| Other | 0.8% | |
| Whatcom | Clinton | 41.8% | |
| Bush | 37.4% | |
| Perot | 19.6% | |
| Other | 1.3% | |
| Whitman | Clinton | 43.7% | |
| Bush | 36.8% | |
| Perot | 18.4% | |
| Other | 1.1% | |
| Yakima | Clinton | 36.3% | |
| Bush | 44.6% | |
| Perot | 18.3% | |
| Other | 0.9% | |