1996 Presidential General Election Data Graphs - Washington
Note: The Google advertisement links below may advocate political positions that this site does not endorse.
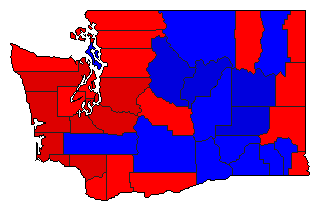
Map

AdamsClinton37.7%
 
Dole51.1%
 
Perot9.7%
 
Other1.5%


AsotinClinton45.8%
 
Dole39.1%
 
Perot12.8%
 
Other2.3%


BentonClinton38.6%
 
Dole49.6%
 
Perot9.9%
 
Other1.9%


ChelanClinton36.0%
 
Dole51.8%
 
Perot9.8%
 
Other2.4%


ClallamClinton42.6%
 
Dole42.1%
 
Perot10.8%
 
Other4.4%


ClarkClinton46.4%
 
Dole41.5%
 
Perot8.6%
 
Other3.6%


ColumbiaClinton38.0%
 
Dole48.5%
 
Perot11.7%
 
Other1.8%


CowlitzClinton53.9%
 
Dole33.5%
 
Perot10.3%
 
Other2.4%


DouglasClinton35.8%
 
Dole52.0%
 
Perot10.4%
 
Other1.8%


FerryClinton42.5%
 
Dole38.7%
 
Perot14.5%
 
Other4.3%


FranklinClinton41.0%
 
Dole49.2%
 
Perot8.2%
 
Other1.6%


GarfieldClinton39.6%
 
Dole49.6%
 
Perot9.3%
 
Other1.4%


GrantClinton36.9%
 
Dole49.8%
 
Perot11.4%
 
Other1.9%


Grays HarborClinton53.6%
 
Dole29.1%
 
Perot14.3%
 
Other3.0%


IslandClinton42.7%
 
Dole43.5%
 
Perot9.8%
 
Other4.0%


JeffersonClinton50.6%
 
Dole32.6%
 
Perot9.8%
 
Other7.0%


KingClinton56.4%
 
Dole31.4%
 
Perot6.9%
 
Other5.3%


KitsapClinton48.3%
 
Dole38.6%
 
Perot9.6%
 
Other3.5%


KittitasClinton45.4%
 
Dole41.6%
 
Perot9.7%
 
Other3.3%


KlickitatClinton45.5%
 
Dole37.7%
 
Perot12.4%
 
Other4.4%


LewisClinton37.4%
 
Dole47.9%
 
Perot12.2%
 
Other2.5%


LincolnClinton35.9%
 
Dole51.4%
 
Perot10.3%
 
Other2.4%


MasonClinton48.6%
 
Dole34.5%
 
Perot13.6%
 
Other3.4%


OkanoganClinton36.8%
 
Dole45.0%
 
Perot13.7%
 
Other4.4%


PacificClinton55.9%
 
Dole28.5%
 
Perot12.4%
 
Other3.2%


Pend OreilleClinton42.6%
 
Dole40.3%
 
Perot14.2%
 
Other3.0%


PierceClinton50.6%
 
Dole37.4%
 
Perot9.2%
 
Other2.9%


San JuanClinton49.8%
 
Dole34.3%
 
Perot6.9%
 
Other9.0%


SkagitClinton44.5%
 
Dole39.9%
 
Perot11.7%
 
Other3.9%


SkamaniaClinton45.5%
 
Dole36.6%
 
Perot11.9%
 
Other6.0%


SnohomishClinton49.5%
 
Dole36.9%
 
Perot10.3%
 
Other3.4%


SpokaneClinton45.0%
 
Dole41.8%
 
Perot10.4%
 
Other2.7%


StevensClinton34.9%
 
Dole47.0%
 
Perot13.5%
 
Other4.7%


ThurstonClinton52.2%
 
Dole34.2%
 
Perot8.7%
 
Other4.9%


WahkiakumClinton50.3%
 
Dole33.7%
 
Perot11.7%
 
Other4.2%


Walla WallaClinton41.3%
 
Dole46.6%
 
Perot9.7%
 
Other2.4%


WhatcomClinton45.1%
 
Dole42.1%
 
Perot7.5%
 
Other5.3%


WhitmanClinton45.7%
 
Dole42.4%
 
Perot8.3%
 
Other3.7%


YakimaClinton43.3%
 
Dole46.6%
 
Perot8.0%
 
Other2.2%


National DataGraph for 1996 - Washington Results for 1996

Login

Terms of Use - DCMA Policy - Privacy Policy and Cookies


© Dave Leip's Atlas of U.S. Elections, LLC 2019 All Rights Reserved