1998 Secretary of State General Election Data Graphs - Iowa
Note: The Google advertisement links below may advocate political positions that this site does not endorse.
Data for this Contest was Contributed by on 2007-02-04
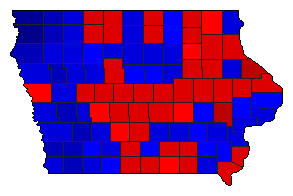
Map

AdairCulver45.1%
 
Gilliand51.4%
 
Other3.5%


AdamsCulver46.1%
 
Gilliand49.9%
 
Other4.0%


AllamakeeCulver46.2%
 
Gilliand50.5%
 
Other3.3%


AppanooseCulver49.1%
 
Gilliand48.4%
 
Other2.5%


AudubonCulver48.8%
 
Gilliand50.3%
 
Other0.8%


BentonCulver53.3%
 
Gilliand43.4%
 
Other3.3%


Black HawkCulver56.5%
 
Gilliand40.9%
 
Other2.5%


BooneCulver54.9%
 
Gilliand41.6%
 
Other3.5%


BremerCulver48.8%
 
Gilliand48.3%
 
Other2.8%


BuchananCulver55.4%
 
Gilliand40.2%
 
Other4.4%


Buena VistaCulver41.0%
 
Gilliand55.6%
 
Other3.4%


ButlerCulver41.6%
 
Gilliand55.5%
 
Other2.9%


CalhounCulver44.8%
 
Gilliand52.0%
 
Other3.1%


CarrollCulver53.9%
 
Gilliand43.1%
 
Other3.1%


CassCulver33.5%
 
Gilliand62.2%
 
Other4.3%


CedarCulver47.5%
 
Gilliand49.0%
 
Other3.4%


Cerro GordoCulver51.7%
 
Gilliand45.2%
 
Other3.1%


CherokeeCulver44.6%
 
Gilliand51.8%
 
Other3.6%


ChickasawCulver55.6%
 
Gilliand40.1%
 
Other4.2%


ClarkeCulver53.2%
 
Gilliand42.8%
 
Other4.0%


ClayCulver42.5%
 
Gilliand55.6%
 
Other1.9%


ClaytonCulver50.6%
 
Gilliand47.8%
 
Other1.6%


ClintonCulver48.7%
 
Gilliand49.8%
 
Other1.5%


CrawfordCulver46.5%
 
Gilliand51.5%
 
Other2.0%


DallasCulver50.9%
 
Gilliand46.6%
 
Other2.5%


DavisCulver53.8%
 
Gilliand43.1%
 
Other3.1%


DecaturCulver52.2%
 
Gilliand43.5%
 
Other4.2%


DelawareCulver47.6%
 
Gilliand51.2%
 
Other1.3%


Des MoinesCulver59.5%
 
Gilliand38.9%
 
Other1.6%


DickinsonCulver45.6%
 
Gilliand50.3%
 
Other4.0%


DubuqueCulver62.2%
 
Gilliand35.3%
 
Other2.6%


EmmetCulver50.1%
 
Gilliand45.4%
 
Other4.6%


FayetteCulver52.1%
 
Gilliand44.7%
 
Other3.2%


FloydCulver47.4%
 
Gilliand48.6%
 
Other4.0%


FranklinCulver42.0%
 
Gilliand55.6%
 
Other2.5%


FremontCulver36.0%
 
Gilliand59.6%
 
Other4.4%


GreeneCulver50.7%
 
Gilliand46.3%
 
Other3.0%


GrundyCulver40.1%
 
Gilliand57.7%
 
Other2.2%


GuthrieCulver49.0%
 
Gilliand48.0%
 
Other3.0%


HamiltonCulver48.2%
 
Gilliand48.8%
 
Other3.0%


HancockCulver40.2%
 
Gilliand56.1%
 
Other3.7%


HardinCulver48.0%
 
Gilliand49.5%
 
Other2.6%


HarrisonCulver41.7%
 
Gilliand53.4%
 
Other4.9%


HenryCulver46.4%
 
Gilliand49.4%
 
Other4.2%


HowardCulver54.6%
 
Gilliand40.8%
 
Other4.6%


HumboldtCulver41.0%
 
Gilliand55.5%
 
Other3.5%


IdaCulver35.1%
 
Gilliand62.1%
 
Other2.8%


IowaCulver47.3%
 
Gilliand49.1%
 
Other3.7%


JacksonCulver56.2%
 
Gilliand40.4%
 
Other3.5%


JasperCulver54.0%
 
Gilliand43.2%
 
Other2.8%


JeffersonCulver33.2%
 
Gilliand44.5%
 
Other22.3%


JohnsonCulver62.4%
 
Gilliand33.3%
 
Other4.3%


JonesCulver51.5%
 
Gilliand45.2%
 
Other3.4%


KeokukCulver48.2%
 
Gilliand49.8%
 
Other2.0%


KossuthCulver52.3%
 
Gilliand44.6%
 
Other3.0%


LeeCulver59.8%
 
Gilliand36.3%
 
Other4.0%


LinnCulver54.1%
 
Gilliand42.7%
 
Other3.2%


LouisaCulver42.7%
 
Gilliand53.9%
 
Other3.4%


LucasCulver47.8%
 
Gilliand49.4%
 
Other2.8%


LyonCulver22.1%
 
Gilliand75.9%
 
Other2.0%


MadisonCulver49.4%
 
Gilliand47.0%
 
Other3.5%


MahaskaCulver40.4%
 
Gilliand56.8%
 
Other2.9%


MarionCulver42.2%
 
Gilliand56.4%
 
Other1.5%


MarshallCulver50.5%
 
Gilliand46.5%
 
Other3.0%


MillsCulver31.0%
 
Gilliand64.4%
 
Other4.6%


MitchellCulver47.1%
 
Gilliand49.7%
 
Other3.3%


MononaCulver49.4%
 
Gilliand45.0%
 
Other5.6%


MonroeCulver54.3%
 
Gilliand42.0%
 
Other3.7%


MontgomeryCulver29.5%
 
Gilliand66.2%
 
Other4.3%


MuscatineCulver42.6%
 
Gilliand54.1%
 
Other3.3%


O'BrienCulver28.7%
 
Gilliand68.9%
 
Other2.4%


OsceolaCulver30.1%
 
Gilliand67.1%
 
Other2.8%


PageCulver26.3%
 
Gilliand69.9%
 
Other3.9%


Palo AltoCulver55.3%
 
Gilliand43.4%
 
Other1.3%


PlymouthCulver31.6%
 
Gilliand67.2%
 
Other1.2%


PocahontasCulver46.7%
 
Gilliand49.3%
 
Other3.9%


PolkCulver55.4%
 
Gilliand41.8%
 
Other2.9%


PottawattamieCulver39.6%
 
Gilliand56.2%
 
Other4.2%


PoweshiekCulver49.0%
 
Gilliand47.3%
 
Other3.7%


RinggoldCulver47.6%
 
Gilliand49.2%
 
Other3.2%


SacCulver41.0%
 
Gilliand56.4%
 
Other2.6%


ScottCulver44.3%
 
Gilliand53.0%
 
Other2.7%


ShelbyCulver34.6%
 
Gilliand64.3%
 
Other1.1%


SiouxCulver13.5%
 
Gilliand85.9%
 
Other0.6%


StoryCulver54.3%
 
Gilliand42.0%
 
Other3.7%


TamaCulver52.3%
 
Gilliand44.7%
 
Other3.0%


TaylorCulver43.9%
 
Gilliand52.9%
 
Other3.2%


UnionCulver46.8%
 
Gilliand50.8%
 
Other2.4%


Van BurenCulver38.9%
 
Gilliand57.1%
 
Other4.0%


WapelloCulver58.8%
 
Gilliand37.6%
 
Other3.6%


WarrenCulver52.6%
 
Gilliand45.0%
 
Other2.4%


WashingtonCulver45.0%
 
Gilliand51.7%
 
Other3.2%


WayneCulver50.3%
 
Gilliand49.4%
 
Other0.3%


WebsterCulver52.2%
 
Gilliand44.7%
 
Other3.1%


WinnebagoCulver43.0%
 
Gilliand53.3%
 
Other3.7%


WinneshiekCulver49.2%
 
Gilliand47.4%
 
Other3.4%


WoodburyCulver45.6%
 
Gilliand51.1%
 
Other3.3%


WorthCulver50.7%
 
Gilliand44.8%
 
Other4.5%


WrightCulver45.1%
 
Gilliand54.1%
 
Other0.8%


National DataGraph for 1998 - Iowa Results for 1998

Login

Terms of Use - DCMA Policy - Privacy Policy and Cookies


© Dave Leip's Atlas of U.S. Elections, LLC 2019 All Rights Reserved