2000 Presidential General Election Data Graphs - Massachusetts
by County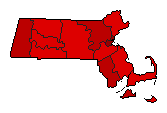
| Barnstable | Gore | 51.5% | |
| Bush | 41.0% | |
| Nader | 6.6% | |
| Other | 0.9% | |
| Berkshire | Gore | 63.9% | |
| Bush | 26.6% | |
| Nader | 7.5% | |
| Other | 2.0% | |
| Bristol | Gore | 64.5% | |
| Bush | 29.7% | |
| Nader | 4.5% | |
| Other | 1.2% | |
| Dukes | Gore | 61.8% | |
| Bush | 26.1% | |
| Nader | 11.1% | |
| Other | 0.9% | |
| Essex | Gore | 57.5% | |
| Bush | 35.4% | |
| Nader | 5.8% | |
| Other | 1.3% | |
| Franklin | Gore | 53.8% | |
| Bush | 30.5% | |
| Nader | 13.9% | |
| Other | 1.9% | |
| Hampden | Gore | 58.2% | |
| Bush | 34.6% | |
| Nader | 6.0% | |
| Other | 1.2% | |
| Hampshire | Gore | 56.2% | |
| Bush | 28.0% | |
| Nader | 14.6% | |
| Other | 1.3% | |
| Middlesex | Gore | 61.5% | |
| Bush | 30.3% | |
| Nader | 6.9% | |
| Other | 1.3% | |
| Nantucket | Gore | 58.3% | |
| Bush | 33.0% | |
| Nader | 7.7% | |
| Other | 1.0% | |
| Norfolk | Gore | 59.4% | |
| Bush | 33.7% | |
| Nader | 5.5% | |
| Other | 1.3% | |
| Plymouth | Gore | 54.5% | |
| Bush | 39.1% | |
| Nader | 5.2% | |
| Other | 1.1% | |
| Suffolk | Gore | 71.4% | |
| Bush | 20.5% | |
| Nader | 6.9% | |
| Other | 1.2% | |
| Worcester | Gore | 56.0% | |
| Bush | 36.8% | |
| Nader | 5.9% | |
| Other | 1.3% | |