2000 Presidential General Election Data Graphs - New Jersey
by County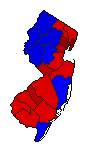
| Atlantic | Gore | 58.0% | |
| Bush | 39.1% | |
| Nader | 2.4% | |
| Other | 0.5% | |
| Bergen | Gore | 55.3% | |
| Bush | 41.6% | |
| Nader | 2.6% | |
| Other | 0.4% | |
| Burlington | Gore | 56.0% | |
| Bush | 40.7% | |
| Nader | 2.8% | |
| Other | 0.5% | |
| Camden | Gore | 64.6% | |
| Bush | 31.7% | |
| Nader | 3.1% | |
| Other | 0.6% | |
| Cape May | Gore | 46.6% | |
| Bush | 50.0% | |
| Nader | 2.7% | |
| Other | 0.7% | |
| Cumberland | Gore | 57.9% | |
| Bush | 38.8% | |
| Nader | 2.1% | |
| Other | 1.3% | |
| Essex | Gore | 71.5% | |
| Bush | 25.8% | |
| Nader | 2.2% | |
| Other | 0.6% | |
| Gloucester | Gore | 56.9% | |
| Bush | 39.4% | |
| Nader | 3.0% | |
| Other | 0.6% | |
| Hudson | Gore | 70.6% | |
| Bush | 26.2% | |
| Nader | 2.7% | |
| Other | 0.5% | |
| Hunterdon | Gore | 37.9% | |
| Bush | 57.1% | |
| Nader | 4.4% | |
| Other | 0.7% | |
| Mercer | Gore | 61.4% | |
| Bush | 34.4% | |
| Nader | 3.4% | |
| Other | 0.8% | |
| Middlesex | Gore | 59.9% | |
| Bush | 36.1% | |
| Nader | 3.5% | |
| Other | 0.5% | |
| Monmouth | Gore | 50.2% | |
| Bush | 45.5% | |
| Nader | 3.5% | |
| Other | 0.9% | |
| Morris | Gore | 42.6% | |
| Bush | 53.8% | |
| Nader | 3.1% | |
| Other | 0.5% | |
| Ocean | Gore | 47.2% | |
| Bush | 48.8% | |
| Nader | 3.4% | |
| Other | 0.6% | |
| Passaic | Gore | 57.7% | |
| Bush | 39.0% | |
| Nader | 2.4% | |
| Other | 0.9% | |
| Salem | Gore | 50.9% | |
| Bush | 45.4% | |
| Nader | 2.6% | |
| Other | 1.0% | |
| Somerset | Gore | 46.7% | |
| Bush | 49.6% | |
| Nader | 3.1% | |
| Other | 0.5% | |
| Sussex | Gore | 37.1% | |
| Bush | 57.9% | |
| Nader | 4.2% | |
| Other | 0.8% | |
| Union | Gore | 60.1% | |
| Bush | 36.8% | |
| Nader | 2.7% | |
| Other | 0.5% | |
| Warren | Gore | 40.5% | |
| Bush | 54.3% | |
| Nader | 4.4% | |
| Other | 0.7% | |