2000 Presidential General Election Data Graphs - New York
by County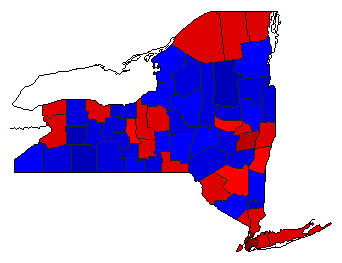
| Albany | Gore | 60.3% | |
| Bush | 33.5% | |
| Nader | 5.1% | |
| Other | 1.1% | |
| Allegany | Gore | 33.9% | |
| Bush | 61.2% | |
| Nader | 3.5% | |
| Other | 1.4% | |
| Bronx | Gore | 86.3% | |
| Bush | 11.8% | |
| Nader | 1.4% | |
| Other | 0.6% | |
| Broome | Gore | 52.1% | |
| Bush | 42.4% | |
| Nader | 4.4% | |
| Other | 1.1% | |
| Cattaraugus | Gore | 41.0% | |
| Bush | 54.5% | |
| Nader | 3.2% | |
| Other | 1.3% | |
| Cayuga | Gore | 50.1% | |
| Bush | 44.1% | |
| Nader | 4.3% | |
| Other | 1.5% | |
| Chautauqua | Gore | 46.0% | |
| Bush | 49.5% | |
| Nader | 3.2% | |
| Other | 1.3% | |
| Chemung | Gore | 46.2% | |
| Bush | 49.8% | |
| Nader | 3.2% | |
| Other | 0.8% | |
| Chenango | Gore | 45.0% | |
| Bush | 49.5% | |
| Nader | 4.3% | |
| Other | 1.2% | |
| Clinton | Gore | 50.9% | |
| Bush | 43.4% | |
| Nader | 3.9% | |
| Other | 1.8% | |
| Columbia | Gore | 47.0% | |
| Bush | 45.8% | |
| Nader | 5.9% | |
| Other | 1.2% | |
| Cortland | Gore | 46.8% | |
| Bush | 47.6% | |
| Nader | 4.5% | |
| Other | 1.1% | |
| Delaware | Gore | 41.9% | |
| Bush | 52.8% | |
| Nader | 4.1% | |
| Other | 1.1% | |
| Dutchess | Gore | 46.9% | |
| Bush | 47.1% | |
| Nader | 5.0% | |
| Other | 1.0% | |
| Erie | Gore | 56.6% | |
| Bush | 37.7% | |
| Nader | 4.3% | |
| Other | 1.4% | |
| Essex | Gore | 44.2% | |
| Bush | 49.2% | |
| Nader | 4.7% | |
| Other | 1.9% | |
| Franklin | Gore | 50.8% | |
| Bush | 43.8% | |
| Nader | 3.8% | |
| Other | 1.6% | |
| Fulton | Gore | 43.0% | |
| Bush | 52.8% | |
| Nader | 3.1% | |
| Other | 1.2% | |
| Genesee | Gore | 39.1% | |
| Bush | 55.5% | |
| Nader | 3.5% | |
| Other | 1.9% | |
| Greene | Gore | 40.2% | |
| Bush | 53.7% | |
| Nader | 4.4% | |
| Other | 1.7% | |
| Hamilton | Gore | 30.3% | |
| Bush | 64.9% | |
| Nader | 3.6% | |
| Other | 1.3% | |
| Herkimer | Gore | 44.1% | |
| Bush | 51.1% | |
| Nader | 3.5% | |
| Other | 1.3% | |
| Jefferson | Gore | 46.1% | |
| Bush | 49.9% | |
| Nader | 2.8% | |
| Other | 1.1% | |
| Kings | Gore | 80.6% | |
| Bush | 15.7% | |
| Nader | 3.2% | |
| Other | 0.5% | |
| Lewis | Gore | 39.6% | |
| Bush | 55.8% | |
| Nader | 3.0% | |
| Other | 1.6% | |
| Livingston | Gore | 38.5% | |
| Bush | 56.0% | |
| Nader | 3.9% | |
| Other | 1.7% | |
| Madison | Gore | 42.4% | |
| Bush | 52.5% | |
| Nader | 3.8% | |
| Other | 1.3% | |
| Monroe | Gore | 50.9% | |
| Bush | 44.4% | |
| Nader | 3.6% | |
| Other | 1.0% | |
| Montgomery | Gore | 49.3% | |
| Bush | 46.9% | |
| Nader | 2.3% | |
| Other | 1.5% | |
| Nassau | Gore | 58.0% | |
| Bush | 38.5% | |
| Nader | 2.5% | |
| Other | 1.1% | |
| New York | Gore | 79.6% | |
| Bush | 14.4% | |
| Nader | 5.5% | |
| Other | 0.6% | |
| Niagara | Gore | 51.2% | |
| Bush | 43.9% | |
| Nader | 3.5% | |
| Other | 1.4% | |
| Oneida | Gore | 45.8% | |
| Bush | 49.6% | |
| Nader | 3.3% | |
| Other | 1.4% | |
| Onondaga | Gore | 54.0% | |
| Bush | 41.1% | |
| Nader | 3.8% | |
| Other | 1.2% | |
| Ontario | Gore | 43.0% | |
| Bush | 52.0% | |
| Nader | 3.9% | |
| Other | 1.1% | |
| Orange | Gore | 46.0% | |
| Bush | 49.7% | |
| Nader | 3.3% | |
| Other | 1.1% | |
| Orleans | Gore | 37.8% | |
| Bush | 58.1% | |
| Nader | 3.0% | |
| Other | 1.1% | |
| Oswego | Gore | 47.1% | |
| Bush | 48.0% | |
| Nader | 3.5% | |
| Other | 1.4% | |
| Otsego | Gore | 45.2% | |
| Bush | 48.2% | |
| Nader | 5.6% | |
| Other | 1.0% | |
| Putnam | Gore | 43.5% | |
| Bush | 51.4% | |
| Nader | 4.1% | |
| Other | 1.0% | |
| Queens | Gore | 75.0% | |
| Bush | 22.0% | |
| Nader | 2.5% | |
| Other | 0.6% | |
| Rensselaer | Gore | 50.9% | |
| Bush | 43.2% | |
| Nader | 4.8% | |
| Other | 1.1% | |
| Richmond | Gore | 51.9% | |
| Bush | 45.0% | |
| Nader | 2.5% | |
| Other | 0.6% | |
| Rockland | Gore | 56.7% | |
| Bush | 39.5% | |
| Nader | 2.9% | |
| Other | 0.9% | |
| St. Lawrence | Gore | 53.8% | |
| Bush | 41.3% | |
| Nader | 3.7% | |
| Other | 1.2% | |
| Saratoga | Gore | 45.6% | |
| Bush | 49.0% | |
| Nader | 4.4% | |
| Other | 1.0% | |
| Schenectady | Gore | 53.1% | |
| Bush | 41.8% | |
| Nader | 4.1% | |
| Other | 1.1% | |
| Schoharie | Gore | 39.8% | |
| Bush | 55.0% | |
| Nader | 4.1% | |
| Other | 1.1% | |
| Schuyler | Gore | 40.5% | |
| Bush | 53.7% | |
| Nader | 4.5% | |
| Other | 1.3% | |
| Seneca | Gore | 47.7% | |
| Bush | 47.0% | |
| Nader | 3.9% | |
| Other | 1.4% | |
| Steuben | Gore | 36.0% | |
| Bush | 59.7% | |
| Nader | 3.1% | |
| Other | 1.3% | |
| Suffolk | Gore | 53.4% | |
| Bush | 42.0% | |
| Nader | 3.2% | |
| Other | 1.5% | |
| Sullivan | Gore | 50.3% | |
| Bush | 44.5% | |
| Nader | 4.1% | |
| Other | 1.1% | |
| Tioga | Gore | 40.8% | |
| Bush | 54.5% | |
| Nader | 3.8% | |
| Other | 0.9% | |
| Tompkins | Gore | 54.4% | |
| Bush | 33.3% | |
| Nader | 11.4% | |
| Other | 0.9% | |
| Ulster | Gore | 48.8% | |
| Bush | 42.8% | |
| Nader | 7.3% | |
| Other | 1.1% | |
| Warren | Gore | 42.6% | |
| Bush | 52.4% | |
| Nader | 4.1% | |
| Other | 0.9% | |
| Washington | Gore | 40.9% | |
| Bush | 53.5% | |
| Nader | 4.2% | |
| Other | 1.4% | |
| Wayne | Gore | 39.1% | |
| Bush | 56.6% | |
| Nader | 3.1% | |
| Other | 1.2% | |
| Westchester | Gore | 58.6% | |
| Bush | 37.5% | |
| Nader | 3.1% | |
| Other | 0.8% | |
| Wyoming | Gore | 34.0% | |
| Bush | 61.3% | |
| Nader | 3.1% | |
| Other | 1.6% | |
| Yates | Gore | 39.4% | |
| Bush | 55.3% | |
| Nader | 3.8% | |
| Other | 1.5% | |