2000 Presidential General Election Data Graphs - Ohio
by County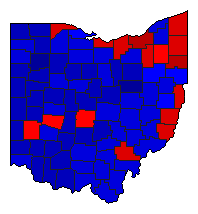
| Adams | Gore | 35.0% | |
| Bush | 62.3% | |
| Nader | 1.6% | |
| Other | 1.1% | |
| Allen | Gore | 32.0% | |
| Bush | 65.4% | |
| Nader | 1.7% | |
| Other | 0.9% | |
| Ashland | Gore | 31.4% | |
| Bush | 63.7% | |
| Nader | 2.6% | |
| Other | 2.2% | |
| Ashtabula | Gore | 50.2% | |
| Bush | 45.4% | |
| Nader | 2.8% | |
| Other | 1.5% | |
| Athens | Gore | 51.7% | |
| Bush | 38.1% | |
| Nader | 6.5% | |
| Other | 3.6% | |
| Auglaize | Gore | 28.0% | |
| Bush | 69.2% | |
| Nader | 1.9% | |
| Other | 0.9% | |
| Belmont | Gore | 53.0% | |
| Bush | 41.9% | |
| Nader | 2.4% | |
| Other | 2.7% | |
| Brown | Gore | 36.4% | |
| Bush | 61.0% | |
| Nader | 1.6% | |
| Other | 1.0% | |
| Butler | Gore | 33.9% | |
| Bush | 63.3% | |
| Nader | 2.0% | |
| Other | 0.8% | |
| Carroll | Gore | 40.5% | |
| Bush | 54.9% | |
| Nader | 2.2% | |
| Other | 2.4% | |
| Champaign | Gore | 38.0% | |
| Bush | 58.8% | |
| Nader | 2.2% | |
| Other | 1.0% | |
| Clark | Gore | 48.6% | |
| Bush | 48.1% | |
| Nader | 2.3% | |
| Other | 1.0% | |
| Clermont | Gore | 29.9% | |
| Bush | 67.4% | |
| Nader | 1.9% | |
| Other | 0.7% | |
| Clinton | Gore | 31.8% | |
| Bush | 65.2% | |
| Nader | 2.2% | |
| Other | 0.9% | |
| Columbiana | Gore | 46.5% | |
| Bush | 49.1% | |
| Nader | 2.7% | |
| Other | 1.7% | |
| Coshocton | Gore | 39.2% | |
| Bush | 57.8% | |
| Nader | 2.1% | |
| Other | 1.0% | |
| Crawford | Gore | 35.0% | |
| Bush | 60.8% | |
| Nader | 2.8% | |
| Other | 1.3% | |
| Cuyahoga | Gore | 62.6% | |
| Bush | 33.4% | |
| Nader | 2.9% | |
| Other | 1.0% | |
| Darke | Gore | 33.3% | |
| Bush | 63.7% | |
| Nader | 1.9% | |
| Other | 1.1% | |
| Defiance | Gore | 38.0% | |
| Bush | 58.7% | |
| Nader | 2.2% | |
| Other | 1.0% | |
| Delaware | Gore | 30.9% | |
| Bush | 66.1% | |
| Nader | 2.2% | |
| Other | 0.8% | |
| Erie | Gore | 50.6% | |
| Bush | 46.0% | |
| Nader | 2.5% | |
| Other | 0.9% | |
| Fairfield | Gore | 35.2% | |
| Bush | 62.0% | |
| Nader | 2.1% | |
| Other | 0.7% | |
| Fayette | Gore | 36.2% | |
| Bush | 61.3% | |
| Nader | 1.8% | |
| Other | 0.7% | |
| Franklin | Gore | 48.8% | |
| Bush | 47.8% | |
| Nader | 2.6% | |
| Other | 0.8% | |
| Fulton | Gore | 36.0% | |
| Bush | 61.1% | |
| Nader | 2.0% | |
| Other | 0.9% | |
| Gallia | Gore | 38.1% | |
| Bush | 58.8% | |
| Nader | 1.7% | |
| Other | 1.4% | |
| Geauga | Gore | 36.0% | |
| Bush | 59.7% | |
| Nader | 3.3% | |
| Other | 1.1% | |
| Greene | Gore | 38.4% | |
| Bush | 58.2% | |
| Nader | 2.4% | |
| Other | 0.9% | |
| Guernsey | Gore | 43.1% | |
| Bush | 53.0% | |
| Nader | 2.6% | |
| Other | 1.3% | |
| Hamilton | Gore | 42.8% | |
| Bush | 54.0% | |
| Nader | 2.4% | |
| Other | 0.8% | |
| Hancock | Gore | 28.7% | |
| Bush | 68.5% | |
| Nader | 1.9% | |
| Other | 0.8% | |
| Hardin | Gore | 37.8% | |
| Bush | 59.0% | |
| Nader | 2.0% | |
| Other | 1.2% | |
| Harrison | Gore | 46.8% | |
| Bush | 47.7% | |
| Nader | 2.7% | |
| Other | 2.8% | |
| Henry | Gore | 33.0% | |
| Bush | 64.4% | |
| Nader | 1.9% | |
| Other | 0.7% | |
| Highland | Gore | 34.5% | |
| Bush | 63.0% | |
| Nader | 1.6% | |
| Other | 0.9% | |
| Hocking | Gore | 41.6% | |
| Bush | 53.0% | |
| Nader | 2.7% | |
| Other | 2.7% | |
| Holmes | Gore | 22.6% | |
| Bush | 73.9% | |
| Nader | 1.9% | |
| Other | 1.7% | |
| Huron | Gore | 38.3% | |
| Bush | 57.5% | |
| Nader | 2.6% | |
| Other | 1.5% | |
| Jackson | Gore | 41.1% | |
| Bush | 55.7% | |
| Nader | 1.8% | |
| Other | 1.4% | |
| Jefferson | Gore | 50.5% | |
| Bush | 43.4% | |
| Nader | 2.6% | |
| Other | 3.5% | |
| Knox | Gore | 33.6% | |
| Bush | 63.0% | |
| Nader | 2.1% | |
| Other | 1.3% | |
| Lake | Gore | 45.3% | |
| Bush | 50.5% | |
| Nader | 3.1% | |
| Other | 1.1% | |
| Lawrence | Gore | 46.2% | |
| Bush | 51.2% | |
| Nader | 1.6% | |
| Other | 0.9% | |
| Licking | Gore | 37.1% | |
| Bush | 59.5% | |
| Nader | 2.4% | |
| Other | 0.9% | |
| Logan | Gore | 32.2% | |
| Bush | 64.2% | |
| Nader | 2.4% | |
| Other | 1.1% | |
| Lorain | Gore | 53.3% | |
| Bush | 42.8% | |
| Nader | 2.8% | |
| Other | 1.1% | |
| Lucas | Gore | 57.8% | |
| Bush | 39.1% | |
| Nader | 2.3% | |
| Other | 0.8% | |
| Madison | Gore | 36.0% | |
| Bush | 60.6% | |
| Nader | 2.0% | |
| Other | 1.3% | |
| Mahoning | Gore | 60.6% | |
| Bush | 35.5% | |
| Nader | 2.9% | |
| Other | 1.0% | |
| Marion | Gore | 41.8% | |
| Bush | 54.9% | |
| Nader | 2.4% | |
| Other | 1.0% | |
| Medina | Gore | 39.8% | |
| Bush | 55.8% | |
| Nader | 2.9% | |
| Other | 1.4% | |
| Meigs | Gore | 37.5% | |
| Bush | 58.7% | |
| Nader | 2.3% | |
| Other | 1.5% | |
| Mercer | Gore | 28.5% | |
| Bush | 68.2% | |
| Nader | 2.1% | |
| Other | 1.1% | |
| Miami | Gore | 36.4% | |
| Bush | 60.8% | |
| Nader | 2.1% | |
| Other | 0.8% | |
| Monroe | Gore | 50.7% | |
| Bush | 44.2% | |
| Nader | 2.1% | |
| Other | 3.0% | |
| Montgomery | Gore | 49.6% | |
| Bush | 47.5% | |
| Nader | 2.0% | |
| Other | 0.8% | |
| Morgan | Gore | 37.7% | |
| Bush | 57.6% | |
| Nader | 3.0% | |
| Other | 1.7% | |
| Morrow | Gore | 35.3% | |
| Bush | 61.1% | |
| Nader | 2.4% | |
| Other | 1.3% | |
| Muskingum | Gore | 41.1% | |
| Bush | 55.2% | |
| Nader | 2.7% | |
| Other | 1.0% | |
| Noble | Gore | 38.3% | |
| Bush | 57.4% | |
| Nader | 2.6% | |
| Other | 1.7% | |
| Ottawa | Gore | 47.5% | |
| Bush | 49.7% | |
| Nader | 2.2% | |
| Other | 0.7% | |
| Paulding | Gore | 37.8% | |
| Bush | 58.2% | |
| Nader | 2.7% | |
| Other | 1.2% | |
| Perry | Gore | 46.0% | |
| Bush | 50.2% | |
| Nader | 2.6% | |
| Other | 1.2% | |
| Pickaway | Gore | 37.2% | |
| Bush | 60.4% | |
| Nader | 1.6% | |
| Other | 0.8% | |
| Pike | Gore | 46.6% | |
| Bush | 50.5% | |
| Nader | 1.7% | |
| Other | 1.2% | |
| Portage | Gore | 50.0% | |
| Bush | 44.9% | |
| Nader | 3.7% | |
| Other | 1.3% | |
| Preble | Gore | 35.1% | |
| Bush | 61.5% | |
| Nader | 2.2% | |
| Other | 1.2% | |
| Putnam | Gore | 23.4% | |
| Bush | 74.0% | |
| Nader | 1.5% | |
| Other | 1.1% | |
| Richland | Gore | 39.0% | |
| Bush | 57.1% | |
| Nader | 2.5% | |
| Other | 1.4% | |
| Ross | Gore | 44.8% | |
| Bush | 52.7% | |
| Nader | 1.6% | |
| Other | 0.9% | |
| Sandusky | Gore | 43.3% | |
| Bush | 53.2% | |
| Nader | 2.3% | |
| Other | 1.2% | |
| Scioto | Gore | 46.7% | |
| Bush | 50.2% | |
| Nader | 2.0% | |
| Other | 1.1% | |
| Seneca | Gore | 39.1% | |
| Bush | 56.9% | |
| Nader | 2.7% | |
| Other | 1.3% | |
| Shelby | Gore | 33.5% | |
| Bush | 63.4% | |
| Nader | 2.0% | |
| Other | 1.1% | |
| Stark | Gore | 47.1% | |
| Bush | 48.9% | |
| Nader | 2.5% | |
| Other | 1.5% | |
| Summit | Gore | 53.3% | |
| Bush | 43.0% | |
| Nader | 2.6% | |
| Other | 1.1% | |
| Trumbull | Gore | 59.9% | |
| Bush | 36.0% | |
| Nader | 2.9% | |
| Other | 1.2% | |
| Tuscarawas | Gore | 42.8% | |
| Bush | 52.7% | |
| Nader | 2.9% | |
| Other | 1.7% | |
| Union | Gore | 29.6% | |
| Bush | 67.6% | |
| Nader | 2.0% | |
| Other | 0.9% | |
| Van Wert | Gore | 31.8% | |
| Bush | 65.7% | |
| Nader | 1.6% | |
| Other | 0.9% | |
| Vinton | Gore | 41.2% | |
| Bush | 55.0% | |
| Nader | 2.2% | |
| Other | 1.6% | |
| Warren | Gore | 27.7% | |
| Bush | 69.9% | |
| Nader | 1.5% | |
| Other | 0.8% | |
| Washington | Gore | 39.2% | |
| Bush | 57.9% | |
| Nader | 2.2% | |
| Other | 0.8% | |
| Wayne | Gore | 34.8% | |
| Bush | 61.0% | |
| Nader | 2.8% | |
| Other | 1.4% | |
| Williams | Gore | 34.3% | |
| Bush | 62.4% | |
| Nader | 2.2% | |
| Other | 1.1% | |
| Wood | Gore | 43.5% | |
| Bush | 52.7% | |
| Nader | 2.9% | |
| Other | 0.9% | |
| Wyandot | Gore | 34.6% | |
| Bush | 62.2% | |
| Nader | 1.9% | |
| Other | 1.3% | |