2000 Presidential General Election Data Graphs - Oklahoma
Note: The Google advertisement links below may advocate political positions that this site does not endorse.
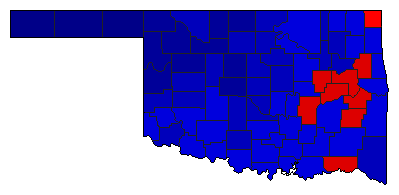
Map

AdairGore39.5%
 
Bush58.6%
 
Nader0.0%
 
Other1.9%


AlfalfaGore23.3%
 
Bush75.2%
 
Nader0.0%
 
Other1.5%


AtokaGore44.1%
 
Bush54.9%
 
Nader0.0%
 
Other1.0%


BeaverGore13.8%
 
Bush85.2%
 
Nader0.0%
 
Other1.0%


BeckhamGore36.9%
 
Bush62.3%
 
Nader0.0%
 
Other0.9%


BlaineGore34.2%
 
Bush64.3%
 
Nader0.0%
 
Other1.4%


BryanGore47.3%
 
Bush51.8%
 
Nader0.0%
 
Other0.9%


CaddoGore46.4%
 
Bush52.5%
 
Nader0.0%
 
Other1.1%


CanadianGore26.7%
 
Bush72.3%
 
Nader0.0%
 
Other1.0%


CarterGore40.5%
 
Bush58.7%
 
Nader0.0%
 
Other0.8%


CherokeeGore50.2%
 
Bush47.8%
 
Nader0.0%
 
Other2.0%


ChoctawGore52.7%
 
Bush46.3%
 
Nader0.0%
 
Other1.0%


CimarronGore15.3%
 
Bush82.9%
 
Nader0.0%
 
Other1.8%


ClevelandGore36.5%
 
Bush62.2%
 
Nader0.0%
 
Other1.3%


CoalGore48.6%
 
Bush50.6%
 
Nader0.0%
 
Other0.8%


ComancheGore40.8%
 
Bush58.3%
 
Nader0.0%
 
Other0.9%


CottonGore43.0%
 
Bush55.9%
 
Nader0.0%
 
Other1.0%


CraigGore46.8%
 
Bush51.3%
 
Nader0.0%
 
Other1.8%


CreekGore41.1%
 
Bush57.2%
 
Nader0.0%
 
Other1.7%


CusterGore32.0%
 
Bush67.0%
 
Nader0.0%
 
Other1.0%


DelawareGore41.3%
 
Bush57.1%
 
Nader0.0%
 
Other1.7%


DeweyGore27.0%
 
Bush72.4%
 
Nader0.0%
 
Other0.6%


EllisGore23.2%
 
Bush75.2%
 
Nader0.0%
 
Other1.6%


GarfieldGore30.2%
 
Bush68.7%
 
Nader0.0%
 
Other1.1%


GarvinGore42.6%
 
Bush56.2%
 
Nader0.0%
 
Other1.2%


GradyGore37.1%
 
Bush61.7%
 
Nader0.0%
 
Other1.2%


GrantGore28.3%
 
Bush70.4%
 
Nader0.0%
 
Other1.3%


GreerGore39.0%
 
Bush59.8%
 
Nader0.0%
 
Other1.2%


HarmonGore42.1%
 
Bush57.4%
 
Nader0.0%
 
Other0.5%


HarperGore22.2%
 
Bush77.0%
 
Nader0.0%
 
Other0.8%


HaskellGore54.2%
 
Bush44.1%
 
Nader0.0%
 
Other1.7%


HughesGore50.9%
 
Bush47.9%
 
Nader0.0%
 
Other1.2%


JacksonGore30.8%
 
Bush68.5%
 
Nader0.0%
 
Other0.6%


JeffersonGore48.0%
 
Bush50.9%
 
Nader0.0%
 
Other1.1%


JohnstonGore46.0%
 
Bush52.7%
 
Nader0.0%
 
Other1.2%


KayGore33.7%
 
Bush64.8%
 
Nader0.0%
 
Other1.5%


KingfisherGore21.5%
 
Bush77.5%
 
Nader0.0%
 
Other1.0%


KiowaGore41.2%
 
Bush57.9%
 
Nader0.0%
 
Other0.9%


LatimerGore50.8%
 
Bush47.4%
 
Nader0.0%
 
Other1.8%


Le FloreGore43.6%
 
Bush54.8%
 
Nader0.0%
 
Other1.6%


LincolnGore35.4%
 
Bush63.1%
 
Nader0.0%
 
Other1.5%


LoganGore35.0%
 
Bush63.6%
 
Nader0.0%
 
Other1.3%


LoveGore45.4%
 
Bush53.6%
 
Nader0.0%
 
Other1.0%


McClainGore34.9%
 
Bush64.0%
 
Nader0.0%
 
Other1.0%


McCurtainGore35.8%
 
Bush63.0%
 
Nader0.0%
 
Other1.2%


McIntoshGore54.1%
 
Bush44.3%
 
Nader0.0%
 
Other1.7%


MajorGore18.9%
 
Bush79.7%
 
Nader0.0%
 
Other1.3%


MarshallGore45.1%
 
Bush53.9%
 
Nader0.0%
 
Other1.0%


MayesGore47.3%
 
Bush50.9%
 
Nader0.0%
 
Other1.8%


MurrayGore46.0%
 
Bush53.0%
 
Nader0.0%
 
Other1.0%


MuskogeeGore50.7%
 
Bush47.9%
 
Nader0.0%
 
Other1.4%


NobleGore30.1%
 
Bush68.8%
 
Nader0.0%
 
Other1.1%


NowataGore44.2%
 
Bush53.8%
 
Nader0.0%
 
Other2.0%


OkfuskeeGore47.9%
 
Bush50.4%
 
Nader0.0%
 
Other1.7%


OklahomaGore36.6%
 
Bush62.3%
 
Nader0.0%
 
Other1.1%


OkmulgeeGore54.5%
 
Bush44.0%
 
Nader0.0%
 
Other1.5%


OsageGore47.4%
 
Bush51.2%
 
Nader0.0%
 
Other1.5%


OttawaGore49.5%
 
Bush49.3%
 
Nader0.0%
 
Other1.2%


PawneeGore41.1%
 
Bush57.1%
 
Nader0.0%
 
Other1.8%


PayneGore37.4%
 
Bush61.2%
 
Nader0.0%
 
Other1.5%


PittsburgGore46.6%
 
Bush52.1%
 
Nader0.0%
 
Other1.3%


PontotocGore42.0%
 
Bush56.9%
 
Nader0.0%
 
Other1.2%


PottawatomieGore39.3%
 
Bush59.3%
 
Nader0.0%
 
Other1.4%


PushmatahaGore45.3%
 
Bush53.6%
 
Nader0.0%
 
Other1.1%


Roger MillsGore26.1%
 
Bush73.1%
 
Nader0.0%
 
Other0.7%


RogersGore37.3%
 
Bush61.2%
 
Nader0.0%
 
Other1.5%


SeminoleGore48.1%
 
Bush51.0%
 
Nader0.0%
 
Other0.9%


SequoyahGore44.3%
 
Bush54.0%
 
Nader0.0%
 
Other1.8%


StephensGore37.0%
 
Bush62.1%
 
Nader0.0%
 
Other0.9%


TexasGore17.8%
 
Bush81.5%
 
Nader0.0%
 
Other0.7%


TillmanGore41.8%
 
Bush57.3%
 
Nader0.0%
 
Other0.9%


TulsaGore37.3%
 
Bush61.3%
 
Nader0.0%
 
Other1.3%


WagonerGore38.3%
 
Bush60.3%
 
Nader0.0%
 
Other1.4%


WashingtonGore32.0%
 
Bush66.5%
 
Nader0.0%
 
Other1.5%


WashitaGore35.0%
 
Bush63.8%
 
Nader0.0%
 
Other1.2%


WoodsGore30.5%
 
Bush68.6%
 
Nader0.0%
 
Other0.9%


WoodwardGore27.5%
 
Bush71.4%
 
Nader0.0%
 
Other1.2%


National DataGraph for 2000 - Oklahoma Results for 2000

Login

Terms of Use - DCMA Policy - Privacy Policy and Cookies


© Dave Leip's Atlas of U.S. Elections, LLC 2019 All Rights Reserved