2000 Presidential General Election Data Graphs - Washington
by County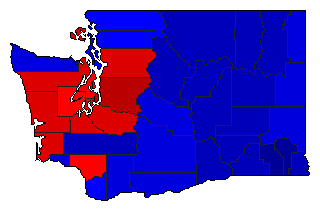
| Adams | Gore | 28.3% | |
| Bush | 69.2% | |
| Nader | 1.7% | |
| Other | 0.9% | |
| Asotin | Gore | 34.3% | |
| Bush | 61.5% | |
| Nader | 2.7% | |
| Other | 1.6% | |
| Benton | Gore | 32.6% | |
| Bush | 64.2% | |
| Nader | 1.8% | |
| Other | 1.3% | |
| Chelan | Gore | 31.7% | |
| Bush | 63.9% | |
| Nader | 3.2% | |
| Other | 1.3% | |
| Clallam | Gore | 42.7% | |
| Bush | 50.4% | |
| Nader | 5.0% | |
| Other | 1.9% | |
| Clark | Gore | 45.6% | |
| Bush | 49.6% | |
| Nader | 3.8% | |
| Other | 1.0% | |
| Columbia | Gore | 24.4% | |
| Bush | 72.3% | |
| Nader | 2.1% | |
| Other | 1.1% | |
| Cowlitz | Gore | 49.3% | |
| Bush | 45.6% | |
| Nader | 3.9% | |
| Other | 1.2% | |
| Douglas | Gore | 29.7% | |
| Bush | 66.2% | |
| Nader | 2.6% | |
| Other | 1.4% | |
| Ferry | Gore | 30.7% | |
| Bush | 62.4% | |
| Nader | 3.9% | |
| Other | 3.1% | |
| Franklin | Gore | 34.2% | |
| Bush | 63.1% | |
| Nader | 1.5% | |
| Other | 1.2% | |
| Garfield | Gore | 22.6% | |
| Bush | 73.9% | |
| Nader | 2.6% | |
| Other | 0.9% | |
| Grant | Gore | 29.7% | |
| Bush | 66.5% | |
| Nader | 2.2% | |
| Other | 1.5% | |
| Grays Harbor | Gore | 51.2% | |
| Bush | 43.2% | |
| Nader | 4.1% | |
| Other | 1.5% | |
| Island | Gore | 44.8% | |
| Bush | 49.7% | |
| Nader | 4.5% | |
| Other | 1.0% | |
| Jefferson | Gore | 52.3% | |
| Bush | 38.5% | |
| Nader | 7.8% | |
| Other | 1.4% | |
| King | Gore | 60.0% | |
| Bush | 34.4% | |
| Nader | 4.7% | |
| Other | 0.9% | |
| Kitsap | Gore | 48.9% | |
| Bush | 45.1% | |
| Nader | 4.5% | |
| Other | 1.5% | |
| Kittitas | Gore | 39.2% | |
| Bush | 54.9% | |
| Nader | 4.6% | |
| Other | 1.4% | |
| Klickitat | Gore | 37.4% | |
| Bush | 55.7% | |
| Nader | 4.8% | |
| Other | 2.0% | |
| Lewis | Gore | 33.0% | |
| Bush | 61.9% | |
| Nader | 3.3% | |
| Other | 1.8% | |
| Lincoln | Gore | 27.3% | |
| Bush | 68.2% | |
| Nader | 3.1% | |
| Other | 1.4% | |
| Mason | Gore | 48.4% | |
| Bush | 45.6% | |
| Nader | 4.6% | |
| Other | 1.4% | |
| Okanogan | Gore | 29.3% | |
| Bush | 63.4% | |
| Nader | 4.9% | |
| Other | 2.4% | |
| Pacific | Gore | 51.4% | |
| Bush | 42.5% | |
| Nader | 4.7% | |
| Other | 1.4% | |
| Pend Oreille | Gore | 36.3% | |
| Bush | 56.6% | |
| Nader | 4.3% | |
| Other | 2.9% | |
| Pierce | Gore | 51.4% | |
| Bush | 44.0% | |
| Nader | 3.3% | |
| Other | 1.3% | |
| San Juan | Gore | 52.5% | |
| Bush | 35.7% | |
| Nader | 10.4% | |
| Other | 1.4% | |
| Skagit | Gore | 45.2% | |
| Bush | 49.0% | |
| Nader | 4.6% | |
| Other | 1.2% | |
| Skamania | Gore | 41.3% | |
| Bush | 50.6% | |
| Nader | 5.9% | |
| Other | 2.2% | |
| Snohomish | Gore | 51.6% | |
| Bush | 43.6% | |
| Nader | 3.6% | |
| Other | 1.2% | |
| Spokane | Gore | 43.3% | |
| Bush | 51.9% | |
| Nader | 3.6% | |
| Other | 1.1% | |
| Stevens | Gore | 30.9% | |
| Bush | 62.8% | |
| Nader | 3.9% | |
| Other | 2.4% | |
| Thurston | Gore | 51.8% | |
| Bush | 41.0% | |
| Nader | 5.9% | |
| Other | 1.3% | |
| Wahkiakum | Gore | 40.7% | |
| Bush | 52.4% | |
| Nader | 4.9% | |
| Other | 2.0% | |
| Walla Walla | Gore | 33.6% | |
| Bush | 62.3% | |
| Nader | 2.9% | |
| Other | 1.2% | |
| Whatcom | Gore | 46.1% | |
| Bush | 46.5% | |
| Nader | 6.1% | |
| Other | 1.3% | |
| Whitman | Gore | 40.1% | |
| Bush | 55.4% | |
| Nader | 3.3% | |
| Other | 1.2% | |
| Yakima | Gore | 37.9% | |
| Bush | 58.6% | |
| Nader | 2.2% | |
| Other | 1.3% | |