2000 Presidential General Election Data Graphs - California
by County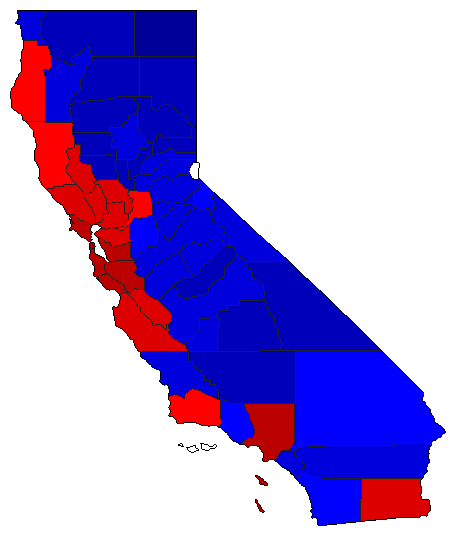
| Alameda | Gore | 69.4% | |
| Bush | 24.1% | |
| Nader | 5.6% | |
| Other | 0.9% | |
| Alpine | Gore | 45.2% | |
| Bush | 48.0% | |
| Nader | 4.3% | |
| Other | 2.6% | |
| Amador | Gore | 38.2% | |
| Bush | 56.7% | |
| Nader | 3.8% | |
| Other | 1.3% | |
| Butte | Gore | 37.4% | |
| Bush | 54.4% | |
| Nader | 6.8% | |
| Other | 1.3% | |
| Calaveras | Gore | 37.6% | |
| Bush | 56.2% | |
| Nader | 4.6% | |
| Other | 1.7% | |
| Colusa | Gore | 31.2% | |
| Bush | 64.9% | |
| Nader | 2.7% | |
| Other | 1.2% | |
| Contra Costa | Gore | 58.8% | |
| Bush | 37.1% | |
| Nader | 3.4% | |
| Other | 0.7% | |
| Del Norte | Gore | 37.6% | |
| Bush | 54.6% | |
| Nader | 5.8% | |
| Other | 2.0% | |
| El Dorado | Gore | 36.3% | |
| Bush | 58.3% | |
| Nader | 4.2% | |
| Other | 1.2% | |
| Fresno | Gore | 43.0% | |
| Bush | 53.1% | |
| Nader | 3.0% | |
| Other | 0.9% | |
| Glenn | Gore | 28.7% | |
| Bush | 66.5% | |
| Nader | 3.1% | |
| Other | 1.7% | |
| Humboldt | Gore | 44.4% | |
| Bush | 41.5% | |
| Nader | 12.7% | |
| Other | 1.4% | |
| Imperial | Gore | 53.5% | |
| Bush | 43.3% | |
| Nader | 2.1% | |
| Other | 1.1% | |
| Inyo | Gore | 33.9% | |
| Bush | 60.3% | |
| Nader | 4.4% | |
| Other | 1.4% | |
| Kern | Gore | 36.2% | |
| Bush | 60.7% | |
| Nader | 1.9% | |
| Other | 1.2% | |
| Kings | Gore | 39.0% | |
| Bush | 57.8% | |
| Nader | 2.0% | |
| Other | 1.2% | |
| Lake | Gore | 51.2% | |
| Bush | 41.6% | |
| Nader | 6.0% | |
| Other | 1.1% | |
| Lassen | Gore | 28.2% | |
| Bush | 66.9% | |
| Nader | 3.2% | |
| Other | 1.7% | |
| Los Angeles | Gore | 63.5% | |
| Bush | 32.4% | |
| Nader | 3.1% | |
| Other | 1.1% | |
| Madera | Gore | 34.9% | |
| Bush | 60.7% | |
| Nader | 3.2% | |
| Other | 1.1% | |
| Marin | Gore | 64.3% | |
| Bush | 28.3% | |
| Nader | 6.7% | |
| Other | 0.7% | |
| Mariposa | Gore | 34.9% | |
| Bush | 58.5% | |
| Nader | 4.7% | |
| Other | 1.9% | |
| Mendocino | Gore | 48.3% | |
| Bush | 35.7% | |
| Nader | 14.7% | |
| Other | 1.3% | |
| Merced | Gore | 45.1% | |
| Bush | 51.8% | |
| Nader | 2.3% | |
| Other | 0.8% | |
| Modoc | Gore | 23.0% | |
| Bush | 72.3% | |
| Nader | 3.0% | |
| Other | 1.7% | |
| Mono | Gore | 40.9% | |
| Bush | 52.5% | |
| Nader | 5.3% | |
| Other | 1.3% | |
| Monterey | Gore | 57.5% | |
| Bush | 37.2% | |
| Nader | 4.3% | |
| Other | 0.9% | |
| Napa | Gore | 54.3% | |
| Bush | 39.9% | |
| Nader | 4.8% | |
| Other | 1.0% | |
| Nevada | Gore | 37.2% | |
| Bush | 54.8% | |
| Nader | 6.9% | |
| Other | 1.1% | |
| Orange | Gore | 40.4% | |
| Bush | 55.8% | |
| Nader | 2.8% | |
| Other | 1.1% | |
| Placer | Gore | 36.0% | |
| Bush | 59.3% | |
| Nader | 3.8% | |
| Other | 0.9% | |
| Plumas | Gore | 33.2% | |
| Bush | 61.0% | |
| Nader | 4.4% | |
| Other | 1.4% | |
| Riverside | Gore | 44.9% | |
| Bush | 51.4% | |
| Nader | 2.6% | |
| Other | 1.1% | |
| Sacramento | Gore | 49.3% | |
| Bush | 45.3% | |
| Nader | 4.1% | |
| Other | 1.3% | |
| San Benito | Gore | 54.3% | |
| Bush | 41.7% | |
| Nader | 3.2% | |
| Other | 0.9% | |
| San Bernardino | Gore | 47.2% | |
| Bush | 48.7% | |
| Nader | 2.6% | |
| Other | 1.5% | |
| San Diego | Gore | 45.7% | |
| Bush | 49.6% | |
| Nader | 3.5% | |
| Other | 1.2% | |
| San Francisco | Gore | 75.5% | |
| Bush | 16.1% | |
| Nader | 7.8% | |
| Other | 0.6% | |
| San Joaquin | Gore | 47.7% | |
| Bush | 48.9% | |
| Nader | 2.5% | |
| Other | 0.9% | |
| San Luis Obispo | Gore | 40.9% | |
| Bush | 52.2% | |
| Nader | 6.0% | |
| Other | 0.9% | |
| San Mateo | Gore | 64.3% | |
| Bush | 31.0% | |
| Nader | 4.0% | |
| Other | 0.7% | |
| Santa Barbara | Gore | 47.4% | |
| Bush | 46.1% | |
| Nader | 5.6% | |
| Other | 0.9% | |
| Santa Clara | Gore | 60.7% | |
| Bush | 34.4% | |
| Nader | 3.5% | |
| Other | 1.4% | |
| Santa Cruz | Gore | 61.5% | |
| Bush | 27.3% | |
| Nader | 10.0% | |
| Other | 1.2% | |
| Shasta | Gore | 30.2% | |
| Bush | 65.0% | |
| Nader | 3.2% | |
| Other | 1.5% | |
| Sierra | Gore | 29.2% | |
| Bush | 63.5% | |
| Nader | 4.7% | |
| Other | 2.7% | |
| Siskiyou | Gore | 31.9% | |
| Bush | 61.5% | |
| Nader | 4.4% | |
| Other | 2.1% | |
| Solano | Gore | 57.0% | |
| Bush | 39.2% | |
| Nader | 2.9% | |
| Other | 0.9% | |
| Sonoma | Gore | 59.5% | |
| Bush | 32.2% | |
| Nader | 7.3% | |
| Other | 0.9% | |
| Stanislaus | Gore | 44.0% | |
| Bush | 52.4% | |
| Nader | 2.6% | |
| Other | 1.0% | |
| Sutter | Gore | 31.7% | |
| Bush | 65.3% | |
| Nader | 2.2% | |
| Other | 0.8% | |
| Tehama | Gore | 31.2% | |
| Bush | 63.6% | |
| Nader | 3.3% | |
| Other | 1.8% | |
| Trinity | Gore | 33.3% | |
| Bush | 57.6% | |
| Nader | 6.8% | |
| Other | 2.2% | |
| Tulare | Gore | 36.7% | |
| Bush | 60.2% | |
| Nader | 2.0% | |
| Other | 1.0% | |
| Tuolumne | Gore | 39.4% | |
| Bush | 55.5% | |
| Nader | 4.0% | |
| Other | 1.0% | |
| Ventura | Gore | 47.1% | |
| Bush | 48.2% | |
| Nader | 3.6% | |
| Other | 1.1% | |
| Yolo | Gore | 54.9% | |
| Bush | 37.5% | |
| Nader | 6.7% | |
| Other | 0.9% | |
| Yuba | Gore | 34.4% | |
| Bush | 61.0% | |
| Nader | 3.1% | |
| Other | 1.5% | |