2002 Secretary of State General Election Data Graphs - Michigan
Note: The Google advertisement links below may advocate political positions that this site does not endorse.
Data for this Contest was Contributed by on 2007-04-03
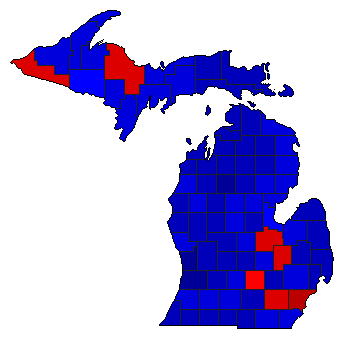
Map

AlconaHollowell40.2%
 
Land58.9%
 
Other0.9%


AlgerHollowell46.7%
 
Land51.2%
 
Other2.1%


AlleganHollowell26.5%
 
Land71.4%
 
Other2.1%


AlpenaHollowell45.5%
 
Land52.6%
 
Other1.9%


AntrimHollowell27.6%
 
Land69.9%
 
Other2.5%


ArenacHollowell44.1%
 
Land52.8%
 
Other3.1%


BaragaHollowell43.5%
 
Land53.9%
 
Other2.7%


BarryHollowell30.5%
 
Land67.3%
 
Other2.2%


BayHollowell47.9%
 
Land49.8%
 
Other2.3%


BenzieHollowell34.9%
 
Land62.9%
 
Other2.2%


BerrienHollowell35.0%
 
Land63.0%
 
Other2.0%


BranchHollowell34.0%
 
Land64.3%
 
Other1.7%


CalhounHollowell42.4%
 
Land55.5%
 
Other2.1%


CassHollowell37.4%
 
Land60.1%
 
Other2.5%


CharlevoixHollowell31.2%
 
Land65.8%
 
Other3.0%


CheboyganHollowell31.1%
 
Land66.7%
 
Other2.2%


ChippewaHollowell34.1%
 
Land63.6%
 
Other2.3%


ClareHollowell42.7%
 
Land54.7%
 
Other2.7%


ClintonHollowell36.1%
 
Land62.1%
 
Other1.8%


CrawfordHollowell33.9%
 
Land63.3%
 
Other2.8%


DeltaHollowell42.6%
 
Land55.6%
 
Other1.8%


DickinsonHollowell41.1%
 
Land56.8%
 
Other2.2%


EatonHollowell41.5%
 
Land56.7%
 
Other1.8%


EmmetHollowell28.3%
 
Land68.9%
 
Other2.8%


GeneseeHollowell53.9%
 
Land44.1%
 
Other2.0%


GladwinHollowell41.5%
 
Land56.5%
 
Other2.0%


GogebicHollowell53.6%
 
Land43.2%
 
Other3.3%


Grand TraverseHollowell28.1%
 
Land69.1%
 
Other2.8%


GratiotHollowell38.4%
 
Land59.9%
 
Other1.6%


HillsdaleHollowell31.8%
 
Land66.7%
 
Other1.5%


HoughtonHollowell39.0%
 
Land58.0%
 
Other3.0%


HuronHollowell31.2%
 
Land66.5%
 
Other2.3%


InghamHollowell49.3%
 
Land48.0%
 
Other2.7%


IoniaHollowell33.4%
 
Land65.4%
 
Other1.3%


IoscoHollowell42.5%
 
Land54.8%
 
Other2.7%


IronHollowell47.4%
 
Land49.2%
 
Other3.4%


IsabellaHollowell41.7%
 
Land55.2%
 
Other3.0%


JacksonHollowell36.1%
 
Land61.5%
 
Other2.4%


KalamazooHollowell39.3%
 
Land58.5%
 
Other2.3%


KalkaskaHollowell34.2%
 
Land63.8%
 
Other2.0%


KentHollowell28.4%
 
Land69.9%
 
Other1.7%


KeweenawHollowell37.2%
 
Land58.4%
 
Other4.4%


LakeHollowell44.2%
 
Land52.6%
 
Other3.2%


LapeerHollowell35.3%
 
Land62.2%
 
Other2.5%


LeelanauHollowell29.9%
 
Land66.8%
 
Other3.2%


LenaweeHollowell40.1%
 
Land58.0%
 
Other1.9%


LivingstonHollowell29.1%
 
Land68.8%
 
Other2.1%


LuceHollowell35.1%
 
Land61.3%
 
Other3.6%


MackinacHollowell33.3%
 
Land64.6%
 
Other2.0%


MacombHollowell37.7%
 
Land60.2%
 
Other2.1%


ManisteeHollowell40.5%
 
Land57.6%
 
Other1.9%


MarquetteHollowell50.5%
 
Land46.5%
 
Other3.0%


MasonHollowell35.2%
 
Land62.3%
 
Other2.5%


MecostaHollowell35.0%
 
Land62.9%
 
Other2.2%


MenomineeHollowell41.6%
 
Land55.8%
 
Other2.6%


MidlandHollowell33.8%
 
Land64.0%
 
Other2.1%


MissaukeeHollowell26.2%
 
Land72.4%
 
Other1.4%


MonroeHollowell40.3%
 
Land57.3%
 
Other2.4%


MontcalmHollowell35.3%
 
Land63.9%
 
Other0.8%


MontmorencyHollowell34.8%
 
Land63.3%
 
Other1.9%


MuskegonHollowell47.2%
 
Land51.3%
 
Other1.5%


NewaygoHollowell32.6%
 
Land65.4%
 
Other2.0%


OaklandHollowell41.7%
 
Land56.4%
 
Other2.0%


OceanaHollowell36.6%
 
Land61.9%
 
Other1.5%


OgemawHollowell43.6%
 
Land53.3%
 
Other3.1%


OntonagonHollowell41.5%
 
Land54.8%
 
Other3.6%


OsceolaHollowell32.2%
 
Land66.0%
 
Other1.7%


OscodaHollowell35.3%
 
Land62.0%
 
Other2.6%


OtsegoHollowell28.5%
 
Land68.7%
 
Other2.8%


OttawaHollowell19.7%
 
Land78.8%
 
Other1.5%


Presque IsleHollowell38.3%
 
Land59.8%
 
Other1.9%


RoscommonHollowell37.2%
 
Land60.2%
 
Other2.6%


SaginawHollowell50.1%
 
Land47.9%
 
Other2.0%


St. ClairHollowell33.4%
 
Land64.3%
 
Other2.3%


St. JosephHollowell30.1%
 
Land67.8%
 
Other2.2%


SanilacHollowell28.7%
 
Land68.3%
 
Other3.0%


SchoolcraftHollowell42.5%
 
Land54.7%
 
Other2.8%


ShiawasseeHollowell42.3%
 
Land55.7%
 
Other2.0%


TuscolaHollowell39.7%
 
Land57.4%
 
Other3.0%


Van BurenHollowell39.3%
 
Land59.3%
 
Other1.4%


WashtenawHollowell51.1%
 
Land45.5%
 
Other3.4%


WayneHollowell61.5%
 
Land36.7%
 
Other1.8%


WexfordHollowell32.0%
 
Land65.6%
 
Other2.4%


National DataGraph for 2002 - Michigan Results for 2002

Login

Terms of Use - DCMA Policy - Privacy Policy and Cookies


© Dave Leip's Atlas of U.S. Elections, LLC 2019 All Rights Reserved