2004 Presidential General Election Data Graphs - Maryland
Note: The Google advertisement links below may advocate political positions that this site does not endorse.
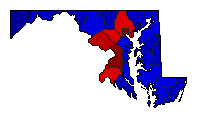
Map

AlleganyKerry35.4%
 
Bush63.6%
 
Other1.0%


Anne ArundelKerry43.1%
 
Bush55.6%
 
Other1.3%


BaltimoreKerry51.6%
 
Bush47.0%
 
Other1.4%


CalvertKerry40.6%
 
Bush58.5%
 
Other0.9%


CarolineKerry33.6%
 
Bush65.1%
 
Other1.3%


CarrollKerry29.0%
 
Bush69.7%
 
Other1.4%


CecilKerry39.0%
 
Bush59.9%
 
Other1.2%


CharlesKerry50.4%
 
Bush48.8%
 
Other0.8%


DorchesterKerry40.6%
 
Bush58.5%
 
Other1.0%


FrederickKerry39.3%
 
Bush59.6%
 
Other1.2%


GarrettKerry26.4%
 
Bush72.8%
 
Other0.9%


HarfordKerry35.2%
 
Bush63.5%
 
Other1.3%


HowardKerry54.0%
 
Bush44.6%
 
Other1.4%


KentKerry46.1%
 
Bush52.8%
 
Other1.2%


MontgomeryKerry66.0%
 
Bush32.8%
 
Other1.2%


Prince George'sKerry81.8%
 
Bush17.4%
 
Other0.8%


Queen Anne'sKerry32.4%
 
Bush66.5%
 
Other1.1%


St. Mary'sKerry36.3%
 
Bush62.6%
 
Other1.1%


SomersetKerry44.9%
 
Bush54.3%
 
Other0.8%


TalbotKerry39.1%
 
Bush59.8%
 
Other1.1%


WashingtonKerry35.2%
 
Bush63.8%
 
Other1.0%


WicomicoKerry40.4%
 
Bush58.7%
 
Other1.0%


WorcesterKerry38.2%
 
Bush60.8%
 
Other0.9%


City

BaltimoreKerry82.0%
 
Bush17.0%
 
Other1.1%


National DataGraph for 2004 - Maryland Results for 2004

Login

Terms of Use - DCMA Policy - Privacy Policy and Cookies


© Dave Leip's Atlas of U.S. Elections, LLC 2019 All Rights Reserved