2004 Presidential General Election Data Graphs - New York
Note: The Google advertisement links below may advocate political positions that this site does not endorse.
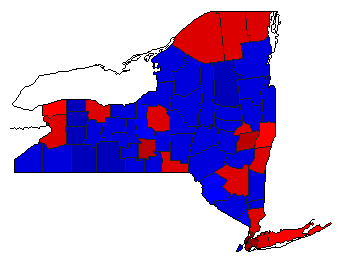
Map

AlbanyKerry60.7%
 
Bush37.3%
 
Other2.0%


AlleganyKerry34.1%
 
Bush63.9%
 
Other2.0%


BronxKerry82.8%
 
Bush16.5%
 
Other0.7%


BroomeKerry50.4%
 
Bush47.4%
 
Other2.2%


CattaraugusKerry39.4%
 
Bush58.5%
 
Other2.0%


CayugaKerry48.6%
 
Bush49.2%
 
Other2.1%


ChautauquaKerry44.7%
 
Bush53.2%
 
Other2.1%


ChemungKerry43.7%
 
Bush54.6%
 
Other1.7%


ChenangoKerry43.5%
 
Bush54.3%
 
Other2.3%


ClintonKerry52.2%
 
Bush45.4%
 
Other2.3%


ColumbiaKerry51.2%
 
Bush46.5%
 
Other2.3%


CortlandKerry46.9%
 
Bush51.0%
 
Other2.1%


DelawareKerry41.2%
 
Bush56.5%
 
Other2.3%


DutchessKerry47.0%
 
Bush51.2%
 
Other1.8%


ErieKerry56.4%
 
Bush41.4%
 
Other2.2%


EssexKerry45.9%
 
Bush51.7%
 
Other2.3%


FranklinKerry52.1%
 
Bush45.8%
 
Other2.1%


FultonKerry41.4%
 
Bush56.6%
 
Other2.0%


GeneseeKerry37.5%
 
Bush60.6%
 
Other1.9%


GreeneKerry39.9%
 
Bush58.0%
 
Other2.1%


HamiltonKerry31.0%
 
Bush67.0%
 
Other2.0%


HerkimerKerry41.2%
 
Bush56.6%
 
Other2.2%


JeffersonKerry43.5%
 
Bush54.7%
 
Other1.8%


KingsKerry74.9%
 
Bush24.3%
 
Other0.8%


LewisKerry39.9%
 
Bush58.1%
 
Other2.0%


LivingstonKerry38.4%
 
Bush59.2%
 
Other2.4%


MadisonKerry43.3%
 
Bush54.6%
 
Other2.1%


MonroeKerry50.6%
 
Bush47.7%
 
Other1.8%


MontgomeryKerry44.5%
 
Bush53.4%
 
Other2.0%


NassauKerry52.2%
 
Bush46.6%
 
Other1.1%


New YorkKerry82.1%
 
Bush16.7%
 
Other1.2%


NiagaraKerry49.3%
 
Bush48.8%
 
Other1.9%


OneidaKerry42.8%
 
Bush54.9%
 
Other2.3%


OnondagaKerry54.2%
 
Bush43.8%
 
Other2.0%


OntarioKerry42.2%
 
Bush55.9%
 
Other1.9%


OrangeKerry43.8%
 
Bush54.7%
 
Other1.5%


OrleansKerry35.9%
 
Bush62.2%
 
Other1.8%


OswegoKerry46.8%
 
Bush51.0%
 
Other2.2%


OtsegoKerry47.7%
 
Bush50.1%
 
Other2.2%


PutnamKerry42.0%
 
Bush56.6%
 
Other1.4%


QueensKerry71.7%
 
Bush27.4%
 
Other0.9%


RensselaerKerry49.7%
 
Bush47.9%
 
Other2.4%


RichmondKerry42.7%
 
Bush56.4%
 
Other0.9%


RocklandKerry48.9%
 
Bush49.6%
 
Other1.5%


St. LawrenceKerry54.7%
 
Bush43.2%
 
Other2.1%


SaratogaKerry45.6%
 
Bush52.5%
 
Other1.9%


SchenectadyKerry51.8%
 
Bush46.2%
 
Other2.1%


SchoharieKerry38.7%
 
Bush59.0%
 
Other2.3%


SchuylerKerry40.1%
 
Bush57.7%
 
Other2.2%


SenecaKerry45.5%
 
Bush52.1%
 
Other2.4%


SteubenKerry34.3%
 
Bush63.8%
 
Other1.8%


SuffolkKerry49.5%
 
Bush48.5%
 
Other2.0%


SullivanKerry48.6%
 
Bush49.5%
 
Other2.0%


TiogaKerry40.6%
 
Bush57.6%
 
Other1.9%


TompkinsKerry64.2%
 
Bush33.0%
 
Other2.8%


UlsterKerry54.3%
 
Bush43.1%
 
Other2.6%


WarrenKerry43.2%
 
Bush54.6%
 
Other2.2%


WashingtonKerry42.3%
 
Bush55.1%
 
Other2.6%


WayneKerry38.1%
 
Bush59.9%
 
Other1.9%


WestchesterKerry58.1%
 
Bush40.3%
 
Other1.6%


WyomingKerry33.8%
 
Bush64.6%
 
Other1.6%


YatesKerry39.3%
 
Bush58.9%
 
Other1.8%


National DataGraph for 2004 - New York Results for 2004

Login

Terms of Use - DCMA Policy - Privacy Policy and Cookies


© Dave Leip's Atlas of U.S. Elections, LLC 2019 All Rights Reserved