2004 Senatorial General Election Data Graphs - New York
Note: The Google advertisement links below may advocate political positions that this site does not endorse.
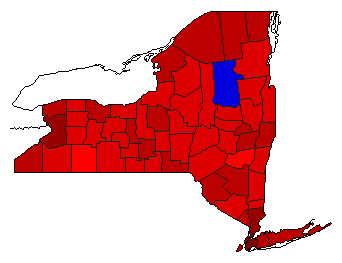
Map

AlbanySchumer69.8%
 
Mills25.5%
 
Other4.7%


AlleganySchumer48.7%
 
Mills45.5%
 
Other5.8%


BronxSchumer90.6%
 
Mills7.4%
 
Other2.0%


BroomeSchumer61.7%
 
Mills33.4%
 
Other4.9%


CattaraugusSchumer55.4%
 
Mills39.5%
 
Other5.1%


CayugaSchumer58.5%
 
Mills34.7%
 
Other6.7%


ChautauquaSchumer61.9%
 
Mills33.6%
 
Other4.5%


ChemungSchumer57.9%
 
Mills37.6%
 
Other4.5%


ChenangoSchumer51.4%
 
Mills42.5%
 
Other6.2%


ClintonSchumer62.1%
 
Mills33.1%
 
Other4.8%


ColumbiaSchumer59.7%
 
Mills34.8%
 
Other5.5%


CortlandSchumer57.4%
 
Mills36.8%
 
Other5.8%


DelawareSchumer50.1%
 
Mills44.0%
 
Other5.9%


DutchessSchumer59.4%
 
Mills34.3%
 
Other6.3%


ErieSchumer72.0%
 
Mills22.8%
 
Other5.2%


EssexSchumer52.8%
 
Mills40.5%
 
Other6.7%


FranklinSchumer61.9%
 
Mills34.0%
 
Other4.2%


FultonSchumer52.7%
 
Mills40.8%
 
Other6.5%


GeneseeSchumer54.9%
 
Mills39.1%
 
Other5.9%


GreeneSchumer49.9%
 
Mills44.1%
 
Other6.0%


HamiltonSchumer43.3%
 
Mills51.3%
 
Other5.4%


HerkimerSchumer57.0%
 
Mills35.9%
 
Other7.1%


JeffersonSchumer64.2%
 
Mills31.0%
 
Other4.7%


KingsSchumer88.1%
 
Mills9.2%
 
Other2.7%


LewisSchumer58.5%
 
Mills36.5%
 
Other5.0%


LivingstonSchumer53.8%
 
Mills40.9%
 
Other5.3%


MadisonSchumer56.4%
 
Mills36.7%
 
Other6.9%


MonroeSchumer66.1%
 
Mills28.4%
 
Other5.6%


MontgomerySchumer59.4%
 
Mills34.0%
 
Other6.6%


NassauSchumer66.5%
 
Mills27.7%
 
Other5.8%


New YorkSchumer87.5%
 
Mills10.2%
 
Other2.4%


NiagaraSchumer65.3%
 
Mills29.1%
 
Other5.6%


OneidaSchumer59.9%
 
Mills33.2%
 
Other6.9%


OnondagaSchumer62.9%
 
Mills30.9%
 
Other6.2%


OntarioSchumer59.6%
 
Mills35.4%
 
Other5.1%


OrangeSchumer55.1%
 
Mills40.0%
 
Other4.9%


OrleansSchumer52.5%
 
Mills42.1%
 
Other5.4%


OswegoSchumer56.3%
 
Mills37.3%
 
Other6.3%


OtsegoSchumer57.1%
 
Mills36.2%
 
Other6.8%


PutnamSchumer58.0%
 
Mills35.2%
 
Other6.9%


QueensSchumer83.7%
 
Mills13.3%
 
Other3.0%


RensselaerSchumer61.5%
 
Mills32.2%
 
Other6.2%


RichmondSchumer68.6%
 
Mills26.4%
 
Other5.0%


RocklandSchumer67.8%
 
Mills27.6%
 
Other4.6%


St. LawrenceSchumer69.8%
 
Mills25.1%
 
Other5.2%


SaratogaSchumer54.7%
 
Mills39.8%
 
Other5.5%


SchenectadySchumer61.9%
 
Mills31.8%
 
Other6.3%


SchoharieSchumer50.2%
 
Mills44.5%
 
Other5.3%


SchuylerSchumer52.8%
 
Mills41.6%
 
Other5.6%


SenecaSchumer60.7%
 
Mills33.9%
 
Other5.3%


SteubenSchumer50.0%
 
Mills45.1%
 
Other4.9%


SuffolkSchumer66.8%
 
Mills27.9%
 
Other5.4%


SullivanSchumer62.1%
 
Mills32.1%
 
Other5.8%


TiogaSchumer50.1%
 
Mills44.2%
 
Other5.7%


TompkinsSchumer68.1%
 
Mills25.0%
 
Other6.9%


UlsterSchumer63.8%
 
Mills29.7%
 
Other6.5%


WarrenSchumer56.0%
 
Mills39.0%
 
Other5.0%


WashingtonSchumer53.9%
 
Mills40.6%
 
Other5.5%


WayneSchumer52.3%
 
Mills41.1%
 
Other6.6%


WestchesterSchumer70.5%
 
Mills25.3%
 
Other4.2%


WyomingSchumer51.8%
 
Mills42.3%
 
Other5.9%


YatesSchumer54.6%
 
Mills40.9%
 
Other4.4%


National DataGraph for 2004 - New York Results for 2004

Login

Terms of Use - DCMA Policy - Privacy Policy and Cookies


© Dave Leip's Atlas of U.S. Elections, LLC 2019 All Rights Reserved