2008 Gubernatorial General Election Data Graphs - North Carolina
Note: The Google advertisement links below may advocate political positions that this site does not endorse.
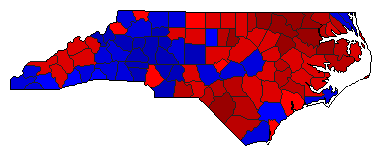
Map

AlamancePerdue47.8%
 
McCrory48.8%
 
0.0%
 
Other3.5%


AlexanderPerdue32.9%
 
McCrory65.3%
 
0.0%
 
Other1.8%


AlleghanyPerdue49.3%
 
McCrory46.6%
 
0.0%
 
Other4.0%


AnsonPerdue63.2%
 
McCrory35.7%
 
0.0%
 
Other1.1%


AshePerdue43.0%
 
McCrory54.2%
 
0.0%
 
Other2.8%


AveryPerdue27.7%
 
McCrory69.8%
 
0.0%
 
Other2.5%


BeaufortPerdue54.5%
 
McCrory43.1%
 
0.0%
 
Other2.4%


BertiePerdue76.4%
 
McCrory22.4%
 
0.0%
 
Other1.2%


BladenPerdue64.8%
 
McCrory33.1%
 
0.0%
 
Other2.1%


BrunswickPerdue45.0%
 
McCrory50.7%
 
0.0%
 
Other4.3%


BuncombePerdue57.2%
 
McCrory38.8%
 
0.0%
 
Other4.0%


BurkePerdue41.7%
 
McCrory56.0%
 
0.0%
 
Other2.3%


CabarrusPerdue34.8%
 
McCrory63.0%
 
0.0%
 
Other2.2%


CaldwellPerdue34.6%
 
McCrory62.7%
 
0.0%
 
Other2.8%


CamdenPerdue46.8%
 
McCrory50.2%
 
0.0%
 
Other2.9%


CarteretPerdue46.5%
 
McCrory50.9%
 
0.0%
 
Other2.6%


CaswellPerdue59.4%
 
McCrory38.0%
 
0.0%
 
Other2.6%


CatawbaPerdue33.1%
 
McCrory64.7%
 
0.0%
 
Other2.1%


ChathamPerdue53.0%
 
McCrory43.2%
 
0.0%
 
Other3.8%


CherokeePerdue41.5%
 
McCrory55.9%
 
0.0%
 
Other2.7%


ChowanPerdue60.5%
 
McCrory37.2%
 
0.0%
 
Other2.3%


ClayPerdue39.7%
 
McCrory57.2%
 
0.0%
 
Other3.1%


ClevelandPerdue41.9%
 
McCrory56.4%
 
0.0%
 
Other1.7%


ColumbusPerdue64.9%
 
McCrory32.6%
 
0.0%
 
Other2.5%


CravenPerdue56.8%
 
McCrory40.9%
 
0.0%
 
Other2.3%


CumberlandPerdue61.9%
 
McCrory35.9%
 
0.0%
 
Other2.2%


CurrituckPerdue43.0%
 
McCrory53.7%
 
0.0%
 
Other3.3%


DarePerdue52.3%
 
McCrory44.9%
 
0.0%
 
Other2.8%


DavidsonPerdue38.5%
 
McCrory57.8%
 
0.0%
 
Other3.7%


DaviePerdue35.0%
 
McCrory61.5%
 
0.0%
 
Other3.4%


DuplinPerdue59.3%
 
McCrory38.7%
 
0.0%
 
Other1.9%


DurhamPerdue70.6%
 
McCrory25.4%
 
0.0%
 
Other4.0%


EdgecombePerdue72.8%
 
McCrory26.1%
 
0.0%
 
Other1.1%


ForsythPerdue54.9%
 
McCrory42.2%
 
0.0%
 
Other2.9%


FranklinPerdue52.4%
 
McCrory44.7%
 
0.0%
 
Other3.0%


GastonPerdue34.8%
 
McCrory63.4%
 
0.0%
 
Other1.8%


GatesPerdue60.3%
 
McCrory38.3%
 
0.0%
 
Other1.5%


GrahamPerdue44.6%
 
McCrory52.2%
 
0.0%
 
Other3.2%


GranvillePerdue55.7%
 
McCrory41.6%
 
0.0%
 
Other2.7%


GreenePerdue61.8%
 
McCrory36.7%
 
0.0%
 
Other1.4%


GuilfordPerdue57.4%
 
McCrory39.5%
 
0.0%
 
Other3.1%


HalifaxPerdue71.1%
 
McCrory27.6%
 
0.0%
 
Other1.3%


HarnettPerdue46.8%
 
McCrory50.7%
 
0.0%
 
Other2.6%


HaywoodPerdue54.1%
 
McCrory42.1%
 
0.0%
 
Other3.8%


HendersonPerdue41.4%
 
McCrory55.1%
 
0.0%
 
Other3.5%


HertfordPerdue77.2%
 
McCrory22.0%
 
0.0%
 
Other0.8%


HokePerdue64.2%
 
McCrory33.7%
 
0.0%
 
Other2.0%


HydePerdue66.1%
 
McCrory31.7%
 
0.0%
 
Other2.1%


IredellPerdue32.8%
 
McCrory65.0%
 
0.0%
 
Other2.2%


JacksonPerdue56.7%
 
McCrory39.3%
 
0.0%
 
Other4.0%


JohnstonPerdue41.7%
 
McCrory55.9%
 
0.0%
 
Other2.4%


JonesPerdue62.3%
 
McCrory35.5%
 
0.0%
 
Other2.2%


LeePerdue49.8%
 
McCrory47.4%
 
0.0%
 
Other2.8%


LenoirPerdue64.5%
 
McCrory34.0%
 
0.0%
 
Other1.5%


LincolnPerdue30.0%
 
McCrory67.8%
 
0.0%
 
Other2.2%


McDowellPerdue45.0%
 
McCrory50.8%
 
0.0%
 
Other4.2%


MaconPerdue46.1%
 
McCrory49.8%
 
0.0%
 
Other4.1%


MadisonPerdue54.6%
 
McCrory41.9%
 
0.0%
 
Other3.6%


MartinPerdue69.5%
 
McCrory29.1%
 
0.0%
 
Other1.4%


MecklenburgPerdue49.0%
 
McCrory48.9%
 
0.0%
 
Other2.0%


MitchellPerdue31.8%
 
McCrory64.7%
 
0.0%
 
Other3.5%


MontgomeryPerdue50.2%
 
McCrory47.7%
 
0.0%
 
Other2.2%


MoorePerdue39.1%
 
McCrory58.2%
 
0.0%
 
Other2.8%


NashPerdue54.9%
 
McCrory43.7%
 
0.0%
 
Other1.4%


New HanoverPerdue49.5%
 
McCrory46.3%
 
0.0%
 
Other4.2%


NorthamptonPerdue72.9%
 
McCrory25.8%
 
0.0%
 
Other1.3%


OnslowPerdue50.0%
 
McCrory46.0%
 
0.0%
 
Other4.0%


OrangePerdue65.1%
 
McCrory30.3%
 
0.0%
 
Other4.7%


PamlicoPerdue59.5%
 
McCrory38.1%
 
0.0%
 
Other2.3%


PasquotankPerdue64.4%
 
McCrory33.4%
 
0.0%
 
Other2.1%


PenderPerdue46.9%
 
McCrory48.0%
 
0.0%
 
Other5.0%


PerquimansPerdue54.4%
 
McCrory43.7%
 
0.0%
 
Other1.9%


PersonPerdue52.3%
 
McCrory45.0%
 
0.0%
 
Other2.7%


PittPerdue59.4%
 
McCrory38.6%
 
0.0%
 
Other2.0%


PolkPerdue47.3%
 
McCrory48.8%
 
0.0%
 
Other3.9%


RandolphPerdue33.3%
 
McCrory62.8%
 
0.0%
 
Other3.9%


RichmondPerdue56.7%
 
McCrory41.3%
 
0.0%
 
Other2.0%


RobesonPerdue70.6%
 
McCrory27.9%
 
0.0%
 
Other1.5%


RockinghamPerdue49.6%
 
McCrory46.7%
 
0.0%
 
Other3.8%


RowanPerdue36.7%
 
McCrory60.9%
 
0.0%
 
Other2.4%


RutherfordPerdue42.5%
 
McCrory54.2%
 
0.0%
 
Other3.3%


SampsonPerdue52.7%
 
McCrory45.9%
 
0.0%
 
Other1.4%


ScotlandPerdue63.3%
 
McCrory35.0%
 
0.0%
 
Other1.7%


StanlyPerdue31.7%
 
McCrory66.3%
 
0.0%
 
Other2.0%


StokesPerdue40.6%
 
McCrory55.2%
 
0.0%
 
Other4.3%


SurryPerdue44.7%
 
McCrory52.2%
 
0.0%
 
Other3.1%


SwainPerdue59.3%
 
McCrory37.2%
 
0.0%
 
Other3.5%


TransylvaniaPerdue46.9%
 
McCrory49.2%
 
0.0%
 
Other3.9%


TyrrellPerdue68.3%
 
McCrory29.1%
 
0.0%
 
Other2.7%


UnionPerdue29.5%
 
McCrory68.6%
 
0.0%
 
Other1.9%


VancePerdue67.7%
 
McCrory30.8%
 
0.0%
 
Other1.5%


WakePerdue51.2%
 
McCrory45.1%
 
0.0%
 
Other3.8%


WarrenPerdue71.4%
 
McCrory27.0%
 
0.0%
 
Other1.5%


WashingtonPerdue73.3%
 
McCrory25.4%
 
0.0%
 
Other1.3%


WataugaPerdue48.2%
 
McCrory47.8%
 
0.0%
 
Other4.0%


WaynePerdue52.2%
 
McCrory45.9%
 
0.0%
 
Other1.8%


WilkesPerdue39.5%
 
McCrory56.8%
 
0.0%
 
Other3.7%


WilsonPerdue57.5%
 
McCrory41.2%
 
0.0%
 
Other1.4%


YadkinPerdue35.6%
 
McCrory60.9%
 
0.0%
 
Other3.4%


YanceyPerdue53.0%
 
McCrory44.6%
 
0.0%
 
Other2.4%


National DataGraph for 2008 - North Carolina Results for 2008

Login

Terms of Use - DCMA Policy - Privacy Policy and Cookies


© Dave Leip's Atlas of U.S. Elections, LLC 2019 All Rights Reserved