2008 Senatorial Democratic Primary Election Data Graphs - Oklahoma
Note: The Google advertisement links below may advocate political positions that this site does not endorse.
Data for this Contest was Contributed by on 2008-10-23
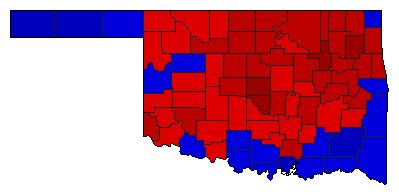
Map

AdairRice60.4%
 
Rogers39.6%


AlfalfaRice59.7%
 
Rogers40.3%


AtokaRice48.6%
 
Rogers51.4%


BeaverRice45.5%
 
Rogers54.5%


BeckhamRice50.4%
 
Rogers49.6%


BlaineRice59.0%
 
Rogers41.0%


BryanRice44.5%
 
Rogers55.5%


CaddoRice56.1%
 
Rogers43.9%


CanadianRice63.3%
 
Rogers36.7%


CarterRice47.0%
 
Rogers53.0%


CherokeeRice64.1%
 
Rogers35.9%


ChoctawRice49.3%
 
Rogers50.7%


CimarronRice36.1%
 
Rogers63.9%


ClevelandRice71.9%
 
Rogers28.1%


CoalRice52.6%
 
Rogers47.4%


ComancheRice51.5%
 
Rogers48.5%


CottonRice51.7%
 
Rogers48.3%


CraigRice62.1%
 
Rogers37.9%


CreekRice64.4%
 
Rogers35.6%


CusterRice55.4%
 
Rogers44.6%


DelawareRice66.5%
 
Rogers33.5%


DeweyRice47.6%
 
Rogers52.4%


EllisRice51.2%
 
Rogers48.8%


GarfieldRice67.3%
 
Rogers32.7%


GarvinRice59.9%
 
Rogers40.1%


GradyRice55.2%
 
Rogers44.8%


GrantRice60.4%
 
Rogers39.6%


GreerRice54.8%
 
Rogers45.2%


HarmonRice60.3%
 
Rogers39.7%


HarperRice50.8%
 
Rogers49.2%


HaskellRice64.1%
 
Rogers35.9%


HughesRice63.1%
 
Rogers36.9%


JacksonRice56.1%
 
Rogers43.9%


JeffersonRice43.7%
 
Rogers56.3%


JohnstonRice64.0%
 
Rogers36.0%


KayRice62.0%
 
Rogers38.0%


KingfisherRice61.8%
 
Rogers38.2%


KiowaRice61.3%
 
Rogers38.7%


LatimerRice57.7%
 
Rogers42.3%


Le FloreRice44.5%
 
Rogers55.5%


LincolnRice52.8%
 
Rogers47.2%


LoganRice64.8%
 
Rogers35.2%


LoveRice41.2%
 
Rogers58.8%


McClainRice56.5%
 
Rogers43.5%


McCurtainRice45.6%
 
Rogers54.4%


McIntoshRice62.2%
 
Rogers37.8%


MajorRice60.3%
 
Rogers39.7%


MarshallRice38.9%
 
Rogers61.1%


MayesRice78.4%
 
Rogers21.6%


MurrayRice59.8%
 
Rogers40.2%


MuskogeeRice70.0%
 
Rogers30.0%


NobleRice62.2%
 
Rogers37.8%


NowataRice63.8%
 
Rogers36.2%


OkfuskeeRice59.5%
 
Rogers40.5%


OklahomaRice72.1%
 
Rogers27.9%


OkmulgeeRice67.4%
 
Rogers32.6%


OsageRice60.3%
 
Rogers39.7%


OttawaRice44.5%
 
Rogers55.5%


PawneeRice57.4%
 
Rogers42.6%


PayneRice66.0%
 
Rogers34.0%


PittsburgRice55.0%
 
Rogers45.0%


PontotocRice56.2%
 
Rogers43.8%


PottawatomieRice61.5%
 
Rogers38.5%


PushmatahaRice34.4%
 
Rogers65.6%


Roger MillsRice42.7%
 
Rogers57.3%


RogersRice67.1%
 
Rogers32.9%


SeminoleRice53.0%
 
Rogers47.0%


SequoyahRice47.5%
 
Rogers52.5%


StephensRice48.6%
 
Rogers51.4%


TexasRice35.6%
 
Rogers64.4%


TillmanRice45.4%
 
Rogers54.6%


TulsaRice70.8%
 
Rogers29.2%


WagonerRice67.4%
 
Rogers32.6%


WashingtonRice66.8%
 
Rogers33.2%


WashitaRice51.0%
 
Rogers49.0%


WoodsRice53.7%
 
Rogers46.3%


WoodwardRice50.3%
 
Rogers49.7%


National DataGraph for 2008 - Oklahoma Results for 2008

Login

Terms of Use - DCMA Policy - Privacy Policy and Cookies


© Dave Leip's Atlas of U.S. Elections, LLC 2019 All Rights Reserved