2008 Presidential General Election Data Graphs - Utah
by County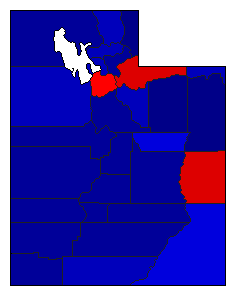
| Beaver | Obama | 21.5% | |
| McCain | 75.5% | |
| Other | 2.9% | |
| Box Elder | Obama | 17.2% | |
| McCain | 79.2% | |
| Other | 3.5% | |
| Cache | Obama | 24.6% | |
| McCain | 69.5% | |
| Other | 6.0% | |
| Carbon | Obama | 44.3% | |
| McCain | 52.3% | |
| Other | 3.4% | |
| Daggett | Obama | 29.5% | |
| McCain | 66.9% | |
| Other | 3.6% | |
| Davis | Obama | 27.5% | |
| McCain | 69.7% | |
| Other | 2.8% | |
| Duchesne | Obama | 15.8% | |
| McCain | 81.2% | |
| Other | 3.0% | |
| Emery | Obama | 21.7% | |
| McCain | 75.0% | |
| Other | 3.2% | |
| Garfield | Obama | 18.6% | |
| McCain | 78.4% | |
| Other | 3.1% | |
| Grand | Obama | 50.4% | |
| McCain | 45.6% | |
| Other | 3.9% | |
| Iron | Obama | 19.5% | |
| McCain | 75.1% | |
| Other | 5.4% | |
| Juab | Obama | 20.2% | |
| McCain | 73.2% | |
| Other | 6.6% | |
| Kane | Obama | 27.0% | |
| McCain | 69.6% | |
| Other | 3.4% | |
| Millard | Obama | 16.0% | |
| McCain | 77.1% | |
| Other | 6.9% | |
| Morgan | Obama | 16.5% | |
| McCain | 79.1% | |
| Other | 4.5% | |
| Piute | Obama | 17.6% | |
| McCain | 79.3% | |
| Other | 3.1% | |
| Rich | Obama | 15.3% | |
| McCain | 82.4% | |
| Other | 2.4% | |
| Salt Lake | Obama | 48.2% | |
| McCain | 48.1% | |
| Other | 3.7% | |
| San Juan | Obama | 46.9% | |
| McCain | 51.4% | |
| Other | 1.7% | |
| Sanpete | Obama | 18.4% | |
| McCain | 75.1% | |
| Other | 6.6% | |
| Sevier | Obama | 16.9% | |
| McCain | 79.3% | |
| Other | 3.8% | |
| Summit | Obama | 56.3% | |
| McCain | 41.1% | |
| Other | 2.6% | |
| Tooele | Obama | 33.4% | |
| McCain | 63.0% | |
| Other | 3.6% | |
| Uintah | Obama | 14.3% | |
| McCain | 82.8% | |
| Other | 2.8% | |
| Utah | Obama | 18.8% | |
| McCain | 77.7% | |
| Other | 3.5% | |
| Wasatch | Obama | 33.5% | |
| McCain | 63.0% | |
| Other | 3.5% | |
| Washington | Obama | 21.6% | |
| McCain | 74.6% | |
| Other | 3.8% | |
| Wayne | Obama | 25.0% | |
| McCain | 70.0% | |
| Other | 5.0% | |
| Weber | Obama | 34.7% | |
| McCain | 62.0% | |
| Other | 3.3% | |