2011 Gubernatorial General Election Data Graphs - West Virginia
Note: The Google advertisement links below may advocate political positions that this site does not endorse.
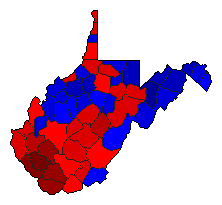
Map

BarbourTomblin50.3%
 
Maloney46.1%
 
Ingels1.1%
 
Other2.5%


BerkeleyTomblin39.2%
 
Maloney58.1%
 
Ingels0.9%
 
Other1.8%


BooneTomblin74.2%
 
Maloney23.7%
 
Ingels0.7%
 
Other1.3%


BraxtonTomblin57.0%
 
Maloney38.9%
 
Ingels0.6%
 
Other3.4%


BrookeTomblin53.3%
 
Maloney43.1%
 
Ingels0.9%
 
Other2.8%


CabellTomblin52.5%
 
Maloney45.0%
 
Ingels0.8%
 
Other1.7%


CalhounTomblin46.1%
 
Maloney48.0%
 
Ingels1.2%
 
Other4.7%


ClayTomblin54.1%
 
Maloney42.0%
 
Ingels0.9%
 
Other3.0%


DoddridgeTomblin28.4%
 
Maloney66.7%
 
Ingels0.9%
 
Other4.0%


FayetteTomblin59.4%
 
Maloney35.8%
 
Ingels1.2%
 
Other3.6%


GilmerTomblin39.9%
 
Maloney51.7%
 
Ingels0.4%
 
Other8.1%


GrantTomblin22.4%
 
Maloney75.6%
 
Ingels0.8%
 
Other1.2%


GreenbrierTomblin49.7%
 
Maloney44.3%
 
Ingels1.1%
 
Other5.0%


HampshireTomblin31.3%
 
Maloney65.2%
 
Ingels1.4%
 
Other2.2%


HancockTomblin51.0%
 
Maloney44.9%
 
Ingels1.3%
 
Other2.7%


HardyTomblin39.1%
 
Maloney55.1%
 
Ingels2.3%
 
Other3.5%


HarrisonTomblin49.0%
 
Maloney48.0%
 
Ingels0.9%
 
Other2.1%


JacksonTomblin45.1%
 
Maloney51.7%
 
Ingels1.5%
 
Other1.6%


JeffersonTomblin47.3%
 
Maloney49.1%
 
Ingels1.0%
 
Other2.6%


KanawhaTomblin49.5%
 
Maloney47.9%
 
Ingels0.6%
 
Other2.0%


LewisTomblin46.2%
 
Maloney49.4%
 
Ingels1.1%
 
Other3.3%


LincolnTomblin66.7%
 
Maloney31.3%
 
Ingels0.6%
 
Other1.4%


LoganTomblin91.6%
 
Maloney7.7%
 
Ingels0.2%
 
Other0.4%


McDowellTomblin76.3%
 
Maloney22.0%
 
Ingels0.6%
 
Other1.1%


MarionTomblin55.1%
 
Maloney41.5%
 
Ingels0.9%
 
Other2.4%


MarshallTomblin49.1%
 
Maloney47.2%
 
Ingels1.1%
 
Other2.5%


MasonTomblin49.3%
 
Maloney45.7%
 
Ingels3.9%
 
Other1.2%


MercerTomblin49.4%
 
Maloney48.0%
 
Ingels1.0%
 
Other1.7%


MineralTomblin35.7%
 
Maloney61.3%
 
Ingels1.1%
 
Other1.9%


MingoTomblin85.2%
 
Maloney13.7%
 
Ingels0.3%
 
Other0.8%


MonongaliaTomblin38.6%
 
Maloney55.4%
 
Ingels0.9%
 
Other5.1%


MonroeTomblin46.5%
 
Maloney48.2%
 
Ingels1.5%
 
Other3.8%


MorganTomblin33.4%
 
Maloney61.9%
 
Ingels1.5%
 
Other3.2%


NicholasTomblin50.6%
 
Maloney44.9%
 
Ingels0.9%
 
Other3.7%


OhioTomblin44.3%
 
Maloney52.7%
 
Ingels0.9%
 
Other2.1%


PendletonTomblin38.1%
 
Maloney57.2%
 
Ingels1.9%
 
Other2.9%


PleasantsTomblin51.4%
 
Maloney45.3%
 
Ingels0.8%
 
Other2.5%


PocahontasTomblin41.8%
 
Maloney47.8%
 
Ingels2.1%
 
Other8.4%


PrestonTomblin34.0%
 
Maloney61.7%
 
Ingels1.4%
 
Other2.9%


PutnamTomblin38.3%
 
Maloney59.5%
 
Ingels0.5%
 
Other1.7%


RaleighTomblin49.3%
 
Maloney47.7%
 
Ingels0.7%
 
Other2.4%


RandolphTomblin54.0%
 
Maloney41.3%
 
Ingels0.8%
 
Other3.8%


RitchieTomblin32.3%
 
Maloney64.3%
 
Ingels1.3%
 
Other2.1%


RoaneTomblin46.6%
 
Maloney48.9%
 
Ingels1.2%
 
Other3.3%


SummersTomblin56.6%
 
Maloney39.1%
 
Ingels1.0%
 
Other3.3%


TaylorTomblin45.9%
 
Maloney50.7%
 
Ingels1.1%
 
Other2.2%


TuckerTomblin50.6%
 
Maloney45.2%
 
Ingels1.5%
 
Other2.8%


TylerTomblin39.4%
 
Maloney55.8%
 
Ingels1.9%
 
Other2.9%


UpshurTomblin37.8%
 
Maloney57.9%
 
Ingels1.3%
 
Other3.0%


WayneTomblin57.6%
 
Maloney40.3%
 
Ingels0.8%
 
Other1.3%


WebsterTomblin63.6%
 
Maloney31.6%
 
Ingels0.9%
 
Other3.8%


WetzelTomblin54.0%
 
Maloney41.2%
 
Ingels1.6%
 
Other3.2%


WirtTomblin46.1%
 
Maloney51.1%
 
Ingels0.9%
 
Other1.8%


WoodTomblin43.4%
 
Maloney53.6%
 
Ingels1.0%
 
Other1.9%


WyomingTomblin71.3%
 
Maloney26.3%
 
Ingels0.7%
 
Other1.7%


National DataGraph for 2011 - West Virginia Results for 2011

Login

Terms of Use - DCMA Policy - Privacy Policy and Cookies


© Dave Leip's Atlas of U.S. Elections, LLC 2019 All Rights Reserved