2012 Presidential General Election Data Graphs - Indiana
Note: The Google advertisement links below may advocate political positions that this site does not endorse.
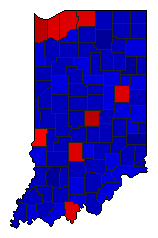
Map

AdamsObama29.2%
 
Romney68.6%
 
Other2.2%


AllenObama40.8%
 
Romney57.5%
 
Other1.8%


BartholomewObama36.1%
 
Romney61.5%
 
Other2.3%


BentonObama32.4%
 
Romney65.1%
 
Other2.5%


BlackfordObama40.5%
 
Romney57.0%
 
Other2.6%


BooneObama30.0%
 
Romney67.7%
 
Other2.3%


BrownObama40.1%
 
Romney56.7%
 
Other3.2%


CarrollObama33.7%
 
Romney64.0%
 
Other2.3%


CassObama37.9%
 
Romney59.6%
 
Other2.5%


ClarkObama44.0%
 
Romney53.8%
 
Other2.2%


ClayObama32.0%
 
Romney65.7%
 
Other2.3%


ClintonObama33.5%
 
Romney64.1%
 
Other2.4%


CrawfordObama44.5%
 
Romney52.7%
 
Other2.8%


DaviessObama23.7%
 
Romney74.4%
 
Other1.8%


DearbornObama29.2%
 
Romney68.9%
 
Other1.9%


DecaturObama28.5%
 
Romney68.9%
 
Other2.6%


DeKalbObama33.1%
 
Romney64.7%
 
Other2.2%


DelawareObama50.3%
 
Romney47.1%
 
Other2.6%


DuboisObama35.1%
 
Romney62.8%
 
Other2.1%


ElkhartObama35.9%
 
Romney62.3%
 
Other1.8%


FayetteObama40.2%
 
Romney57.1%
 
Other2.7%


FloydObama41.9%
 
Romney56.2%
 
Other2.0%


FountainObama31.5%
 
Romney65.6%
 
Other3.0%


FranklinObama27.5%
 
Romney70.2%
 
Other2.3%


FultonObama32.3%
 
Romney65.4%
 
Other2.3%


GibsonObama33.5%
 
Romney64.4%
 
Other2.1%


GrantObama37.9%
 
Romney59.8%
 
Other2.3%


GreeneObama33.1%
 
Romney64.4%
 
Other2.5%


HamiltonObama31.9%
 
Romney66.2%
 
Other1.9%


HancockObama28.4%
 
Romney69.4%
 
Other2.2%


HarrisonObama37.4%
 
Romney60.2%
 
Other2.4%


HendricksObama31.6%
 
Romney66.4%
 
Other2.0%


HenryObama40.1%
 
Romney57.0%
 
Other2.9%


HowardObama41.7%
 
Romney56.0%
 
Other2.3%


HuntingtonObama29.1%
 
Romney68.8%
 
Other2.1%


JacksonObama34.9%
 
Romney62.3%
 
Other2.7%


JasperObama36.2%
 
Romney61.6%
 
Other2.3%


JayObama38.8%
 
Romney58.8%
 
Other2.4%


JeffersonObama43.5%
 
Romney53.9%
 
Other2.5%


JenningsObama37.3%
 
Romney59.7%
 
Other3.0%


JohnsonObama29.7%
 
Romney68.0%
 
Other2.3%


KnoxObama34.5%
 
Romney63.5%
 
Other2.0%


KosciuskoObama22.8%
 
Romney74.8%
 
Other2.4%


LaGrangeObama31.1%
 
Romney66.9%
 
Other2.0%


LakeObama64.8%
 
Romney33.9%
 
Other1.4%


LaPorteObama55.2%
 
Romney42.6%
 
Other2.2%


LawrenceObama32.3%
 
Romney65.0%
 
Other2.6%


MadisonObama46.5%
 
Romney51.0%
 
Other2.5%


MarionObama60.1%
 
Romney37.9%
 
Other2.0%


MarshallObama34.5%
 
Romney63.3%
 
Other2.3%


MartinObama28.5%
 
Romney68.8%
 
Other2.7%


MiamiObama33.0%
 
Romney63.8%
 
Other3.3%


MonroeObama58.4%
 
Romney39.3%
 
Other2.3%


MontgomeryObama29.6%
 
Romney68.0%
 
Other2.4%


MorganObama28.1%
 
Romney69.2%
 
Other2.7%


NewtonObama39.0%
 
Romney58.0%
 
Other3.0%


NobleObama32.1%
 
Romney65.6%
 
Other2.2%


OhioObama35.3%
 
Romney62.4%
 
Other2.3%


OrangeObama37.8%
 
Romney59.4%
 
Other2.8%


OwenObama34.8%
 
Romney62.4%
 
Other2.8%


ParkeObama32.3%
 
Romney64.8%
 
Other2.8%


PerryObama54.8%
 
Romney43.2%
 
Other2.0%


PikeObama35.9%
 
Romney61.2%
 
Other2.9%


PorterObama50.8%
 
Romney46.9%
 
Other2.2%


PoseyObama37.1%
 
Romney60.8%
 
Other2.2%


PulaskiObama35.2%
 
Romney62.3%
 
Other2.5%


PutnamObama32.6%
 
Romney65.1%
 
Other2.3%


RandolphObama36.9%
 
Romney60.9%
 
Other2.1%


RipleyObama29.4%
 
Romney67.9%
 
Other2.6%


RushObama31.6%
 
Romney65.9%
 
Other2.4%


St. JosephObama50.9%
 
Romney47.4%
 
Other1.8%


ScottObama45.8%
 
Romney52.1%
 
Other2.1%


ShelbyObama32.0%
 
Romney65.5%
 
Other2.5%


SpencerObama41.3%
 
Romney56.6%
 
Other2.1%


StarkeObama43.4%
 
Romney54.0%
 
Other2.5%


SteubenObama35.4%
 
Romney62.4%
 
Other2.2%


SullivanObama38.5%
 
Romney59.1%
 
Other2.4%


SwitzerlandObama42.3%
 
Romney55.1%
 
Other2.6%


TippecanoeObama46.8%
 
Romney50.4%
 
Other2.8%


TiptonObama33.0%
 
Romney64.7%
 
Other2.3%


UnionObama32.8%
 
Romney65.1%
 
Other2.1%


VanderburghObama43.7%
 
Romney54.3%
 
Other2.0%


VermillionObama45.1%
 
Romney51.9%
 
Other3.0%


VigoObama49.3%
 
Romney48.4%
 
Other2.3%


WabashObama30.8%
 
Romney67.0%
 
Other2.2%


WarrenObama34.8%
 
Romney62.6%
 
Other2.6%


WarrickObama35.8%
 
Romney62.2%
 
Other2.0%


WashingtonObama36.4%
 
Romney60.8%
 
Other2.7%


WayneObama41.6%
 
Romney56.2%
 
Other2.2%


WellsObama26.5%
 
Romney71.5%
 
Other2.0%


WhiteObama36.6%
 
Romney60.1%
 
Other3.3%


WhitleyObama29.4%
 
Romney68.2%
 
Other2.4%


National DataGraph for 2012 - Indiana Results for 2012

Login

Terms of Use - DCMA Policy - Privacy Policy and Cookies


© Dave Leip's Atlas of U.S. Elections, LLC 2019 All Rights Reserved