2012 Presidential General Election Data Graphs - Iowa
Note: The Google advertisement links below may advocate political positions that this site does not endorse.
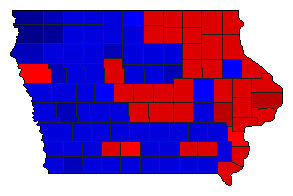
Map

AdairObama44.8%
 
Romney52.9%
 
Other2.3%


AdamsObama47.0%
 
Romney50.7%
 
Other2.2%


AllamakeeObama51.2%
 
Romney47.1%
 
Other1.7%


AppanooseObama47.3%
 
Romney50.6%
 
Other2.1%


AudubonObama46.6%
 
Romney52.1%
 
Other1.3%


BentonObama48.9%
 
Romney49.5%
 
Other1.6%


Black HawkObama59.3%
 
Romney39.1%
 
Other1.6%


BooneObama52.2%
 
Romney45.6%
 
Other2.2%


BremerObama50.7%
 
Romney48.0%
 
Other1.3%


BuchananObama56.1%
 
Romney42.2%
 
Other1.7%


Buena VistaObama44.1%
 
Romney54.3%
 
Other1.5%


ButlerObama44.1%
 
Romney54.4%
 
Other1.5%


CalhounObama42.8%
 
Romney55.3%
 
Other1.9%


CarrollObama46.3%
 
Romney52.5%
 
Other1.2%


CassObama39.7%
 
Romney58.5%
 
Other1.8%


CedarObama51.5%
 
Romney46.9%
 
Other1.5%


Cerro GordoObama55.9%
 
Romney42.5%
 
Other1.6%


CherokeeObama41.1%
 
Romney57.1%
 
Other1.9%


ChickasawObama54.8%
 
Romney43.7%
 
Other1.4%


ClarkeObama49.4%
 
Romney47.9%
 
Other2.6%


ClayObama39.8%
 
Romney58.2%
 
Other2.0%


ClaytonObama52.6%
 
Romney45.6%
 
Other1.8%


ClintonObama60.6%
 
Romney37.7%
 
Other1.7%


CrawfordObama45.4%
 
Romney53.2%
 
Other1.3%


DallasObama43.5%
 
Romney55.1%
 
Other1.4%


DavisObama40.3%
 
Romney56.7%
 
Other3.0%


DecaturObama46.7%
 
Romney50.8%
 
Other2.5%


DelawareObama49.2%
 
Romney49.4%
 
Other1.3%


Des MoinesObama58.3%
 
Romney39.9%
 
Other1.8%


DickinsonObama40.3%
 
Romney58.2%
 
Other1.5%


DubuqueObama56.5%
 
Romney41.8%
 
Other1.7%


EmmetObama44.8%
 
Romney53.5%
 
Other1.7%


FayetteObama55.3%
 
Romney43.3%
 
Other1.4%


FloydObama56.7%
 
Romney42.0%
 
Other1.3%


FranklinObama43.7%
 
Romney54.4%
 
Other1.9%


FremontObama44.6%
 
Romney53.8%
 
Other1.6%


GreeneObama49.0%
 
Romney49.1%
 
Other1.9%


GrundyObama37.8%
 
Romney60.5%
 
Other1.6%


GuthrieObama43.6%
 
Romney53.9%
 
Other2.5%


HamiltonObama47.7%
 
Romney50.3%
 
Other1.9%


HancockObama42.5%
 
Romney56.0%
 
Other1.5%


HardinObama45.8%
 
Romney52.5%
 
Other1.7%


HarrisonObama42.8%
 
Romney55.5%
 
Other1.7%


HenryObama46.0%
 
Romney51.9%
 
Other2.1%


HowardObama59.6%
 
Romney38.6%
 
Other1.8%


HumboldtObama38.2%
 
Romney60.1%
 
Other1.7%


IdaObama36.1%
 
Romney62.4%
 
Other1.5%


IowaObama46.7%
 
Romney51.5%
 
Other1.7%


JacksonObama57.7%
 
Romney40.8%
 
Other1.5%


JasperObama52.6%
 
Romney45.5%
 
Other2.0%


JeffersonObama56.2%
 
Romney40.3%
 
Other3.5%


JohnsonObama66.7%
 
Romney31.2%
 
Other2.1%


JonesObama53.0%
 
Romney45.2%
 
Other1.9%


KeokukObama43.7%
 
Romney54.0%
 
Other2.3%


KossuthObama43.1%
 
Romney55.3%
 
Other1.5%


LeeObama56.7%
 
Romney41.2%
 
Other2.2%


LinnObama57.9%
 
Romney40.2%
 
Other1.9%


LouisaObama49.4%
 
Romney48.7%
 
Other1.9%


LucasObama46.0%
 
Romney52.1%
 
Other1.9%


LyonObama21.9%
 
Romney76.5%
 
Other1.7%


MadisonObama42.9%
 
Romney54.8%
 
Other2.2%


MahaskaObama38.7%
 
Romney59.2%
 
Other2.0%


MarionObama42.4%
 
Romney55.6%
 
Other2.0%


MarshallObama53.8%
 
Romney44.4%
 
Other1.8%


MillsObama39.5%
 
Romney58.5%
 
Other2.1%


MitchellObama50.7%
 
Romney47.3%
 
Other2.0%


MononaObama44.3%
 
Romney53.9%
 
Other1.8%


MonroeObama45.2%
 
Romney52.9%
 
Other1.9%


MontgomeryObama38.2%
 
Romney59.7%
 
Other2.0%


MuscatineObama57.0%
 
Romney41.1%
 
Other1.9%


O'BrienObama26.8%
 
Romney71.7%
 
Other1.4%


OsceolaObama28.6%
 
Romney69.8%
 
Other1.6%


PageObama36.9%
 
Romney61.4%
 
Other1.7%


Palo AltoObama43.8%
 
Romney54.4%
 
Other1.8%


PlymouthObama32.2%
 
Romney66.4%
 
Other1.5%


PocahontasObama37.8%
 
Romney59.4%
 
Other2.8%


PolkObama56.1%
 
Romney42.0%
 
Other1.9%


PottawattamieObama46.4%
 
Romney51.7%
 
Other1.9%


PoweshiekObama53.7%
 
Romney44.4%
 
Other1.9%


RinggoldObama45.6%
 
Romney52.6%
 
Other1.7%


SacObama40.1%
 
Romney58.5%
 
Other1.4%


ScottObama56.1%
 
Romney42.4%
 
Other1.5%


ShelbyObama38.1%
 
Romney60.3%
 
Other1.6%


SiouxObama15.6%
 
Romney83.2%
 
Other1.2%


StoryObama55.6%
 
Romney41.7%
 
Other2.7%


TamaObama52.9%
 
Romney45.4%
 
Other1.7%


TaylorObama42.1%
 
Romney56.2%
 
Other1.7%


UnionObama51.1%
 
Romney47.2%
 
Other1.7%


Van BurenObama39.3%
 
Romney57.8%
 
Other2.9%


WapelloObama54.9%
 
Romney43.1%
 
Other2.0%


WarrenObama48.1%
 
Romney50.1%
 
Other1.8%


WashingtonObama46.5%
 
Romney50.5%
 
Other3.0%


WayneObama43.1%
 
Romney54.6%
 
Other2.3%


WebsterObama52.1%
 
Romney46.3%
 
Other1.6%


WinnebagoObama49.1%
 
Romney49.1%
 
Other1.8%


WinneshiekObama56.4%
 
Romney41.7%
 
Other1.9%


WoodburyObama49.5%
 
Romney48.5%
 
Other1.9%


WorthObama56.3%
 
Romney41.8%
 
Other1.9%


WrightObama45.2%
 
Romney53.3%
 
Other1.5%


National DataGraph for 2012 - Iowa Results for 2012

Login

Terms of Use - DCMA Policy - Privacy Policy and Cookies


© Dave Leip's Atlas of U.S. Elections, LLC 2019 All Rights Reserved