2012 Presidential Republican Primary Election Data Graphs - Maine
by County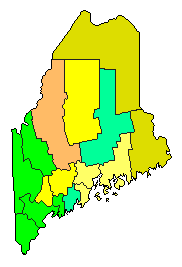
| Androscoggin | Huntsman | 0.0% | |
| Gingrich | 2.4% | |
| Romney | 29.4% | |
| Other | 68.3% | |
| Aroostook | Huntsman | 0.0% | |
| Gingrich | 9.5% | |
| Romney | 19.0% | |
| Other | 71.5% | |
| Cumberland | Huntsman | 0.0% | |
| Gingrich | 4.8% | |
| Romney | 46.9% | |
| Other | 48.3% | |
| Franklin | Huntsman | 0.0% | |
| Gingrich | 15.4% | |
| Romney | 45.4% | |
| Other | 39.2% | |
| Hancock | Huntsman | 0.0% | |
| Gingrich | 9.0% | |
| Romney | 31.1% | |
| Other | 59.9% | |
| Kennebec | Huntsman | 0.0% | |
| Gingrich | 6.3% | |
| Romney | 32.7% | |
| Other | 61.0% | |
| Knox | Huntsman | 0.0% | |
| Gingrich | 9.5% | |
| Romney | 38.1% | |
| Other | 52.4% | |
| Lincoln | Huntsman | 0.0% | |
| Gingrich | 9.7% | |
| Romney | 37.9% | |
| Other | 52.4% | |
| Oxford | Huntsman | 0.0% | |
| Gingrich | 11.4% | |
| Romney | 44.1% | |
| Other | 44.5% | |
| Penobscot | Huntsman | 0.0% | |
| Gingrich | 6.9% | |
| Romney | 37.6% | |
| Other | 55.5% | |
| Piscataquis | Huntsman | 0.0% | |
| Gingrich | 11.6% | |
| Romney | 34.7% | |
| Other | 53.7% | |
| Sagadahoc | Huntsman | 0.0% | |
| Gingrich | 10.8% | |
| Romney | 45.8% | |
| Other | 43.4% | |
| Somerset | Huntsman | 0.0% | |
| Gingrich | 13.5% | |
| Romney | 27.0% | |
| Other | 59.5% | |
| Waldo | Huntsman | 0.0% | |
| Gingrich | 10.0% | |
| Romney | 28.2% | |
| Other | 61.7% | |
| Washington | Huntsman | 0.0% | |
| Gingrich | 2.4% | |
| Romney | 26.2% | |
| Other | 71.3% | |
| York | Huntsman | 0.0% | |
| Gingrich | 3.2% | |
| Romney | 40.7% | |
| Other | 56.1% | |