2012 Senatorial General Election Data Graphs - Minnesota
Note: The Google advertisement links below may advocate political positions that this site does not endorse.
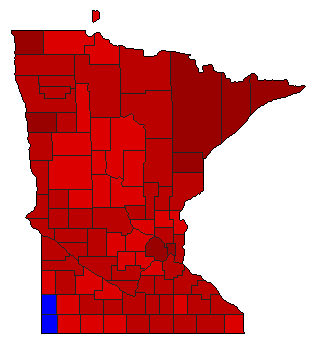
Map

AitkinKlobuchar63.7%
 
Bills31.8%
 
Williams2.8%
 
Other1.6%


AnokaKlobuchar62.6%
 
Bills33.1%
 
Williams2.6%
 
Other1.6%


BeckerKlobuchar56.6%
 
Bills38.4%
 
Williams3.5%
 
Other1.5%


BeltramiKlobuchar63.8%
 
Bills31.5%
 
Williams2.8%
 
Other1.8%


BentonKlobuchar61.3%
 
Bills33.3%
 
Williams3.3%
 
Other2.1%


Big StoneKlobuchar66.6%
 
Bills28.9%
 
Williams3.4%
 
Other1.2%


Blue EarthKlobuchar65.3%
 
Bills28.6%
 
Williams3.4%
 
Other2.7%


BrownKlobuchar60.0%
 
Bills35.4%
 
Williams3.1%
 
Other1.6%


CarltonKlobuchar72.6%
 
Bills23.9%
 
Williams2.3%
 
Other1.3%


CarverKlobuchar55.0%
 
Bills41.7%
 
Williams2.1%
 
Other1.2%


CassKlobuchar57.5%
 
Bills37.9%
 
Williams3.0%
 
Other1.6%


ChippewaKlobuchar69.0%
 
Bills26.3%
 
Williams3.0%
 
Other1.7%


ChisagoKlobuchar59.1%
 
Bills36.6%
 
Williams2.7%
 
Other1.5%


ClayKlobuchar67.0%
 
Bills29.0%
 
Williams2.7%
 
Other1.3%


ClearwaterKlobuchar53.2%
 
Bills41.9%
 
Williams3.1%
 
Other1.8%


CookKlobuchar70.8%
 
Bills25.6%
 
Williams2.4%
 
Other1.2%


CottonwoodKlobuchar60.2%
 
Bills34.6%
 
Williams3.6%
 
Other1.6%


Crow WingKlobuchar58.0%
 
Bills36.9%
 
Williams3.4%
 
Other1.7%


DakotaKlobuchar62.0%
 
Bills34.3%
 
Williams2.3%
 
Other1.4%


DodgeKlobuchar59.0%
 
Bills36.1%
 
Williams3.2%
 
Other1.6%


DouglasKlobuchar59.9%
 
Bills35.5%
 
Williams3.2%
 
Other1.4%


FaribaultKlobuchar63.7%
 
Bills31.6%
 
Williams2.9%
 
Other1.8%


FillmoreKlobuchar64.7%
 
Bills29.5%
 
Williams2.9%
 
Other3.0%


FreebornKlobuchar68.4%
 
Bills27.1%
 
Williams2.9%
 
Other1.5%


GoodhueKlobuchar62.5%
 
Bills32.8%
 
Williams3.1%
 
Other1.6%


GrantKlobuchar64.9%
 
Bills30.3%
 
Williams3.4%
 
Other1.4%


HennepinKlobuchar71.2%
 
Bills25.1%
 
Williams2.1%
 
Other1.6%


HoustonKlobuchar51.8%
 
Bills39.1%
 
Williams3.7%
 
Other5.4%


HubbardKlobuchar56.8%
 
Bills38.6%
 
Williams3.0%
 
Other1.6%


IsantiKlobuchar57.1%
 
Bills38.1%
 
Williams3.0%
 
Other1.8%


ItascaKlobuchar66.4%
 
Bills30.1%
 
Williams2.4%
 
Other1.2%


JacksonKlobuchar59.7%
 
Bills34.1%
 
Williams4.1%
 
Other2.1%


KanabecKlobuchar61.2%
 
Bills34.3%
 
Williams2.5%
 
Other2.0%


KandiyohiKlobuchar62.5%
 
Bills33.5%
 
Williams2.7%
 
Other1.3%


KittsonKlobuchar70.5%
 
Bills26.3%
 
Williams2.2%
 
Other1.0%


KoochichingKlobuchar69.0%
 
Bills27.2%
 
Williams2.3%
 
Other1.5%


Lac Qui ParleKlobuchar68.7%
 
Bills26.6%
 
Williams3.6%
 
Other1.1%


LakeKlobuchar70.7%
 
Bills25.7%
 
Williams1.9%
 
Other1.7%


Lake of the WoodsKlobuchar56.3%
 
Bills38.8%
 
Williams3.8%
 
Other1.1%


Le SueurKlobuchar63.7%
 
Bills31.3%
 
Williams3.0%
 
Other2.0%


LincolnKlobuchar56.8%
 
Bills36.9%
 
Williams4.5%
 
Other1.7%


LyonKlobuchar60.8%
 
Bills33.9%
 
Williams3.7%
 
Other1.6%


McLeodKlobuchar58.3%
 
Bills36.5%
 
Williams3.4%
 
Other1.8%


MahnomenKlobuchar69.8%
 
Bills25.0%
 
Williams3.1%
 
Other2.2%


MarshallKlobuchar64.8%
 
Bills31.6%
 
Williams2.6%
 
Other1.0%


MartinKlobuchar57.8%
 
Bills36.8%
 
Williams3.3%
 
Other2.1%


MeekerKlobuchar59.4%
 
Bills35.3%
 
Williams3.6%
 
Other1.7%


Mille LacsKlobuchar61.2%
 
Bills33.5%
 
Williams3.1%
 
Other2.3%


MorrisonKlobuchar57.3%
 
Bills37.4%
 
Williams3.5%
 
Other1.8%


MowerKlobuchar69.5%
 
Bills24.7%
 
Williams3.3%
 
Other2.4%


MurrayKlobuchar57.5%
 
Bills36.9%
 
Williams4.0%
 
Other1.7%


NicolletKlobuchar67.5%
 
Bills27.7%
 
Williams2.8%
 
Other1.9%


NoblesKlobuchar56.1%
 
Bills37.0%
 
Williams4.7%
 
Other2.3%


NormanKlobuchar72.4%
 
Bills24.0%
 
Williams2.4%
 
Other1.2%


OlmstedKlobuchar61.2%
 
Bills34.2%
 
Williams2.8%
 
Other1.8%


Otter TailKlobuchar53.5%
 
Bills41.8%
 
Williams3.2%
 
Other1.4%


PenningtonKlobuchar64.6%
 
Bills30.8%
 
Williams2.8%
 
Other1.8%


PineKlobuchar62.8%
 
Bills31.7%
 
Williams3.0%
 
Other2.5%


PipestoneKlobuchar44.2%
 
Bills49.7%
 
Williams4.1%
 
Other1.9%


PolkKlobuchar63.4%
 
Bills32.2%
 
Williams2.8%
 
Other1.5%


PopeKlobuchar65.6%
 
Bills30.0%
 
Williams3.0%
 
Other1.4%


RamseyKlobuchar73.5%
 
Bills22.0%
 
Williams2.5%
 
Other2.0%


Red LakeKlobuchar67.8%
 
Bills27.4%
 
Williams3.2%
 
Other1.6%


RedwoodKlobuchar59.1%
 
Bills36.0%
 
Williams3.2%
 
Other1.6%


RenvilleKlobuchar66.0%
 
Bills29.2%
 
Williams3.1%
 
Other1.7%


RiceKlobuchar66.7%
 
Bills28.9%
 
Williams2.7%
 
Other1.7%


RockKlobuchar45.8%
 
Bills47.9%
 
Williams4.5%
 
Other1.9%


RoseauKlobuchar55.8%
 
Bills39.5%
 
Williams3.2%
 
Other1.4%


St. LouisKlobuchar73.8%
 
Bills23.0%
 
Williams2.0%
 
Other1.3%


ScottKlobuchar56.7%
 
Bills39.1%
 
Williams2.8%
 
Other1.5%


SherburneKlobuchar55.3%
 
Bills40.4%
 
Williams2.7%
 
Other1.5%


SibleyKlobuchar60.2%
 
Bills34.9%
 
Williams3.2%
 
Other1.6%


StearnsKlobuchar61.4%
 
Bills33.6%
 
Williams3.2%
 
Other1.8%


SteeleKlobuchar63.6%
 
Bills30.9%
 
Williams3.5%
 
Other2.1%


StevensKlobuchar62.9%
 
Bills33.1%
 
Williams2.5%
 
Other1.5%


SwiftKlobuchar69.9%
 
Bills25.7%
 
Williams2.9%
 
Other1.5%


ToddKlobuchar59.2%
 
Bills36.1%
 
Williams3.1%
 
Other1.6%


TraverseKlobuchar67.8%
 
Bills28.0%
 
Williams2.9%
 
Other1.3%


WabashaKlobuchar62.6%
 
Bills32.5%
 
Williams3.1%
 
Other1.7%


WadenaKlobuchar53.8%
 
Bills41.8%
 
Williams2.8%
 
Other1.6%


WasecaKlobuchar63.5%
 
Bills31.3%
 
Williams3.3%
 
Other1.8%


WashingtonKlobuchar64.0%
 
Bills32.6%
 
Williams2.2%
 
Other1.2%


WatonwanKlobuchar67.6%
 
Bills27.8%
 
Williams2.7%
 
Other1.8%


WilkinKlobuchar60.1%
 
Bills35.6%
 
Williams2.7%
 
Other1.5%


WinonaKlobuchar60.3%
 
Bills32.6%
 
Williams3.9%
 
Other3.1%


WrightKlobuchar54.6%
 
Bills41.0%
 
Williams2.8%
 
Other1.6%


Yellow MedicineKlobuchar66.4%
 
Bills29.2%
 
Williams2.9%
 
Other1.5%


National DataGraph for 2012 - Minnesota Results for 2012

Login

Terms of Use - DCMA Policy - Privacy Policy and Cookies


© Dave Leip's Atlas of U.S. Elections, LLC 2019 All Rights Reserved