2012 Presidential Republican Primary Election Data Graphs - Wyoming
Note: The Google advertisement links below may advocate political positions that this site does not endorse.
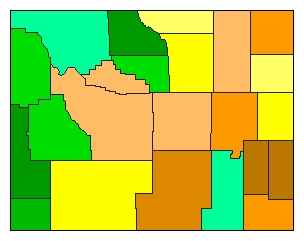
Map

AlbanyHuntsman0.0%
 
Gingrich7.0%
 
Romney35.2%
 
Other57.7%


Big HornHuntsman0.0%
 
Gingrich0.0%
 
Romney70.4%
 
Other29.6%


CampbellHuntsman0.0%
 
Gingrich7.1%
 
Romney21.4%
 
Other71.4%


CarbonHuntsman0.0%
 
Gingrich8.7%
 
Romney26.1%
 
Other65.2%


ConverseHuntsman0.0%
 
Gingrich8.7%
 
Romney18.5%
 
Other72.8%


CrookHuntsman0.0%
 
Gingrich10.9%
 
Romney17.4%
 
Other71.7%


FremontHuntsman0.0%
 
Gingrich16.0%
 
Romney30.7%
 
Other53.3%


GoshenHuntsman0.0%
 
Gingrich6.8%
 
Romney14.4%
 
Other78.8%


Hot SpringsHuntsman0.0%
 
Gingrich16.0%
 
Romney16.0%
 
Other68.0%


JohnsonHuntsman0.0%
 
Gingrich4.0%
 
Romney26.0%
 
Other70.0%


LaramieHuntsman0.0%
 
Gingrich3.8%
 
Romney34.4%
 
Other61.9%


LincolnHuntsman0.0%
 
Gingrich0.0%
 
Romney75.0%
 
Other25.0%


NatronaHuntsman0.0%
 
Gingrich11.1%
 
Romney33.3%
 
Other55.6%


NiobraraHuntsman0.0%
 
Gingrich40.0%
 
Romney15.0%
 
Other45.0%


ParkHuntsman0.0%
 
Gingrich12.3%
 
Romney39.4%
 
Other48.4%


PlatteHuntsman0.0%
 
Gingrich11.9%
 
Romney13.6%
 
Other74.6%


SheridanHuntsman0.0%
 
Gingrich3.3%
 
Romney27.9%
 
Other68.9%


SubletteHuntsman0.0%
 
Gingrich5.0%
 
Romney55.0%
 
Other40.0%


SweetwaterHuntsman0.0%
 
Gingrich7.4%
 
Romney35.8%
 
Other56.8%


TetonHuntsman0.0%
 
Gingrich7.8%
 
Romney56.3%
 
Other35.9%


UintaHuntsman0.0%
 
Gingrich2.9%
 
Romney65.7%
 
Other31.4%


WashakieHuntsman0.0%
 
Gingrich7.0%
 
Romney56.3%
 
Other36.6%


WestonHuntsman0.0%
 
Gingrich26.7%
 
Romney23.3%
 
Other50.0%


National DataGraph for 2012 - Wyoming Results for 2012

Login

Terms of Use - DCMA Policy - Privacy Policy and Cookies


© Dave Leip's Atlas of U.S. Elections, LLC 2019 All Rights Reserved