Home
2024
Election Results
Election Info
Weblog
Forum
Wiki
Search
Email
Login
Site Info
Store
1938 Gubernatorial General Election Results - Maryland
Note: The Google advertisement links below may advocate political positions that this site does not endorse.
Data for this Contest was Contributed by on 2016-04-06
Gubernatorial
Candidate
Political
Party
Popular Vote
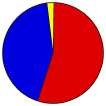
Herbert R. O'Conor
Democratic
308,372
54.62%
Harry W. Nice
Republican
242,095
42.88%
Herbert Brune
Independent
7,503
1.33%
Joshua C. Gwin
Union
4,249
0.75%
Other (
+
)
-
2,321
0.41%
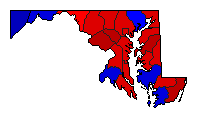
Map Key
> 40%
> 50%
> 60%
> 70%
Turnout
Maps
Demographic Data
1940 Population:
1,821,244
Enum.
1940 Population Density:
71.9
persons/km
2
1930 Population:
1,631,526
Enum.
1930 Population Density:
64.5
persons/km
2
Land Area (2000):
25,314
km
2
Annual Pop Growth Rate:
1.1
%
Election Data and Statistics:
County Data (Table)
(m)
County Data (Graphs)
(m)
Compare State Data by Year (Table)
Compare State Data by Year (Graphs)
View All 1938 Maryland Data
Compare State Maps by Year
View All 1938 Maryland Maps
Election Tools
Atlas Forum
Image Code for Maps:
County
Data Sources:
Source for Popular Vote data: Maryland Secretary of State.
Maryland Manual 1939
, Maryland Secretary of State (http://msa.maryland.gov/megafile/msa/speccol/sc2900/sc2908/000001/000158/pdf/am158--320.pdf) (accessed 5 Feb 2016)
Source for Population data: U.S. Census Bureau.
Results for and Individual County:
(m)
Choose Year
2022
2018
2014
2010
2006
2002
1998
1994
1990
1986
1982
1978
1974
1970
1966
1962
1958
1954
1950
1946
1942
1934
1930
1926
1923
1919
1915
1899
Choose Office
Senator
Attorney General
Comptroller General
Choose State
Arizona
California
Colorado
Connecticut
Iowa
Massachusetts
Michigan
Minnesota
Nebraska
Nevada
New Hampshire
Oregon
Pennsylvania
Vermont
Wisconsin
1990 >
Maryland Election Results Home
-
National Results for 1938
-
Use Frame Navigation
Login
Terms of Use
-
DCMA Policy
-
Privacy Policy and Cookies
©
Dave Leip's Atlas of U.S. Elections, LLC 2019 All Rights Reserved


