Home
2024
Election Results
Election Info
Weblog
Forum
Wiki
Search
Email
Login
Site Info
Store
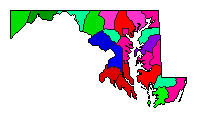
1966 Gubernatorial Democratic Primary Election Results - Maryland
Note: The Google advertisement links below may advocate political positions that this site does not endorse.
Data for this Contest was Contributed by on 2012-12-31
Gubernatorial
Candidate
Political
Party
Popular Vote
George P. Mahoney
Democratic
148,446
30.22%
Carlton R. Sickles
Democratic
146,507
29.82%
Thomas B. Finan
Democratic
134,216
27.32%
Clarence W. Miles
Democratic
42,304
8.61%
Charles J. Luthardt, Sr.
Democratic
7,335
1.49%
Morgan L. Amaimo
Democratic
6,048
1.23%
Ross Z. Pierpont
Democratic
4,311
0.88%
Andrew J. Easter
Democratic
2,098
0.43%
Map Key
> 20%
> 30%
> 40%
> 50%
> 60%
> 70%
Turnout
Maps
Demographic Data
1970 Population:
3,923,897
Enum.
1970 Population Density:
155.0
persons/km
2
1960 Population:
3,100,689
Enum.
1960 Population Density:
122.5
persons/km
2
Land Area (2000):
25,314
km
2
Annual Pop Growth Rate:
2.4
%
Election Data and Statistics:
County Data (Table)
(m)
County Data (Graphs)
Compare State Maps by Year
View All 1966 Maryland Maps
Election Tools
Atlas Forum
Image Code for Maps:
County
Data Sources:
Source for Popular Vote data: Maryland State Archives.
Maryland Manual, 1967-1968
, Maryland State Archives (http://aomol.net/megafile/msa/speccol/sc2900/sc2908/000001/000173/pdf/am173--528.pdf) (accessed 30 Dec 2012)
Source for Population data: U.S. Census Bureau.
Results for and Individual County:
(m)
Choose Year
2022
2018
1994
1990
1986
1978
Choose Office
Choose State
Alabama
Minnesota
Nebraska
Nevada
Oregon
Maryland Election Results Home
-
National Results for 1966
-
Use Frame Navigation
Login
Terms of Use
-
DCMA Policy
-
Privacy Policy and Cookies
©
Dave Leip's Atlas of U.S. Elections, LLC 2019 All Rights Reserved


