Home
2024
Election Results
Election Info
Weblog
Forum
Wiki
Search
Email
Login
Site Info
Store
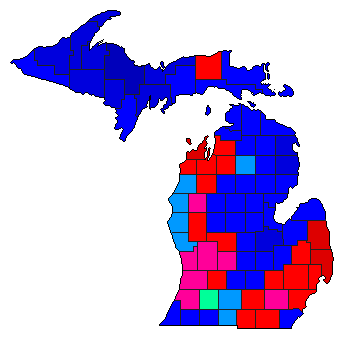
1998 Gubernatorial Democratic Primary Election Results - Michigan
Note: The Google advertisement links below may advocate political positions that this site does not endorse.
Data for this Contest was Contributed by on 2007-04-14
Gubernatorial
Candidate
Political
Party
Popular Vote
Geoffrey Fieger
Democratic
300,458
41.18%
Larry Owen
Democratic
272,360
37.33%
Doug Ross
Democratic
156,847
21.50%
Map Key
> 30%
> 40%
> 50%
> 60%
Turnout
Maps
Pop. (m)
Demographic Data
2000 Population:
9,938,444
Enum.
2000 Population Density:
67.6
persons/km
2
1998 Population:
9,847,942
Est.
1998 Population Density:
66.9
persons/km
2
1990 Population:
9,295,287
Enum.
1990 Population Density:
63.2
persons/km
2
Land Area (2000):
147,121
km
2
Annual Pop Growth Rate:
0.7
%
Election Data and Statistics:
County Data (Table)
(m)
County Data (Graphs)
Purchase Detailed Data
Compare State Maps by Year
View All 1998 Michigan Maps
Election Tools
Atlas Forum
Image Code for Maps:
County
,
Pop
Data Sources:
Source for Popular Vote data: Michigan Department of State.
1998 Official Michigan Primary Election Results
, Michigan Department of State (http://miboecfr.nicusa.com/election/results/98pri/02000000.html) (accessed 14 Apr 2007)
Source for Population data: U.S. Census Bureau.
Results for and Individual County:
(m)
Choose Year
2018
2010
2002
Choose Office
Choose State
Alabama
California
Colorado
Georgia
Idaho
Illinois
Iowa
Kansas
Maine
Minnesota
Nebraska
Oklahoma
Oregon
Tennessee
Wyoming
Michigan Election Results Home
-
National Results for 1998
-
Use Frame Navigation
Login
Terms of Use
-
DCMA Policy
-
Privacy Policy and Cookies
©
Dave Leip's Atlas of U.S. Elections, LLC 2019 All Rights Reserved


