Home
2024
Election Results
Election Info
Weblog
Forum
Wiki
Search
Email
Login
Site Info
Store
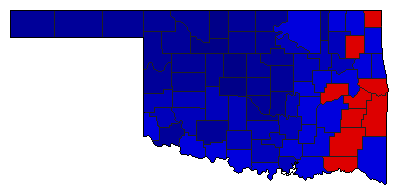
1998 Lt. Gubernatorial General Election Results - Oklahoma
Note: The Google advertisement links below may advocate political positions that this site does not endorse.
Data for this Contest was Contributed by on 2007-02-24
Lt. Gubernatorial
Candidate
Political
Party
Popular Vote
Mary Fallin
Republican
585,712
67.55%
Jack Morgan
Democratic
281,379
32.45%
Map Key
> 50%
> 60%
> 70%
> 80%
Turnout
Maps
Pop. (m)
Demographic Data
2000 Population:
3,450,654
Enum.
2000 Population Density:
19.4
persons/km
2
1998 Population:
3,405,194
Est.
1998 Population Density:
19.1
persons/km
2
1990 Population:
3,145,576
Enum.
1990 Population Density:
17.7
persons/km
2
Land Area (2000):
177,847
km
2
Annual Pop Growth Rate:
0.9
%
Election Data and Statistics:
County Data (Table)
(m)
County Data (Graphs)
Purchase Detailed Data
Compare State Data by Year (Table)
Compare State Data by Year (Graphs)
View All 1998 Oklahoma Data
Compare State Maps by Year
View All 1998 Oklahoma Maps
Election Tools
Atlas Forum
Image Code for Maps:
County
,
Pop
Data Sources:
Source for Popular Vote data: Oklahoma State Board of Elections.
GENERAL ELECTION RESULTS
, Oklahoma State Board of Elections (http://www.state.ok.us/~elections/98genst.html) (accessed 24 Feb 2007)
Source for Population data: U.S. Census Bureau.
Results for and Individual County:
(m)
Choose Year
2022
2018
2014
2010
2006
2002
1994
1990
1986
1982
1978
Choose Office
Senator
Governor
Insurance Commissioner
Choose State
Alabama
Arkansas
California
Georgia
Idaho
Nevada
Rhode Island
South Carolina
Texas
Vermont
2022 >
Oklahoma Election Results Home
-
National Results for 1998
-
Use Frame Navigation
Login
Terms of Use
-
DCMA Policy
-
Privacy Policy and Cookies
©
Dave Leip's Atlas of U.S. Elections, LLC 2019 All Rights Reserved


