Home
2024
Election Results
Election Info
Weblog
Forum
Wiki
Search
Email
Login
Site Info
Store
1958 Lt. Gubernatorial General Election Results - Pennsylvania
Note: The Google advertisement links below may advocate political positions that this site does not endorse.
Data for this Contest was Contributed by on 2016-05-09
Lt. Gubernatorial
Candidate
Political
Party
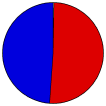
Popular Vote
John Morgan Davis
Democratic
2,002,829
50.77%
John M. Walker
Republican
1,929,112
48.90%
Other (
+
)
-
13,104
0.33%
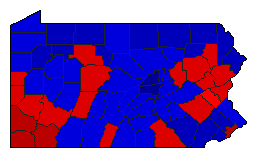
Map Key
> 40%
> 50%
> 60%
> 70%
Turnout
Maps
Demographic Data
1960 Population:
11,319,366
Enum.
1960 Population Density:
97.5
persons/km
2
1950 Population:
10,498,012
Enum.
1950 Population Density:
90.4
persons/km
2
Land Area (2000):
116,074
km
2
Annual Pop Growth Rate:
0.8
%
Election Data and Statistics:
County Data (Table)
(m)
County Data (Graphs)
(m)
Compare State Data by Year (Table)
Compare State Data by Year (Graphs)
View All 1958 Pennsylvania Data
Compare State Maps by Year
View All 1958 Pennsylvania Maps
Election Tools
Atlas Forum
Image Code for Maps:
County
Data Sources:
Source for Popular Vote data: Pennsylvania General Assembly.
Commonwealth of Pennsylvania Legislative Journal Tuesday, January 6, 1959
, Pennsylvania General Assembly (http://www.legis.state.pa.us/WU01/LI/HJ/1959/0/19590106.pdf) (accessed 9 May 2016)
Source for Population data: U.S. Census Bureau.
Results for and Individual County:
(m)
Choose Year
1966
1962
1954
1950
Choose Office
Senator
Governor
Choose State
California
Colorado
Kansas
Massachusetts
Minnesota
Nebraska
Nevada
North Dakota
Rhode Island
South Dakota
Pennsylvania Election Results Home
-
National Results for 1958
-
Use Frame Navigation
Login
Terms of Use
-
DCMA Policy
-
Privacy Policy and Cookies
©
Dave Leip's Atlas of U.S. Elections, LLC 2019 All Rights Reserved


