Home
2024
Election Results
Election Info
Weblog
Forum
Wiki
Search
Email
Login
Site Info
Store
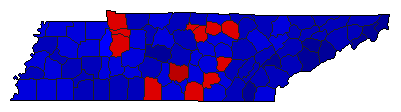
1994 Senatorial Special Election Results - Tennessee
Note: The Google advertisement links below may advocate political positions that this site does not endorse.
Data for this Contest was Contributed by on 2007-03-18
Senatorial
Candidate
Political
Party
Popular Vote
Fred Thompson
Republican
885,998
60.44%
Jim Cooper
Democratic
565,930
38.61%
Charles N. Hancock
Independent
4,169
0.28%
Other (
+
)
-
9,765
0.67%
Map Key
> 40%
> 50%
> 60%
> 70%
Turnout
Maps
Pop. (m)
Election Notes:
Special Election held on the same day as the General Election to fill the seat vacated by Al Gore.
Demographic Data
2000 Population:
5,689,283
Enum.
2000 Population Density:
53.3
persons/km
2
1994 Population:
5,231,438
Est.
1994 Population Density:
49.0
persons/km
2
1990 Population:
4,877,203
Enum.
1990 Population Density:
45.7
persons/km
2
Land Area (2000):
106,752
km
2
Annual Pop Growth Rate:
1.6
%
Election Data and Statistics:
County Data (Table)
(m)
County Data (Graphs)
Purchase Detailed Data
Compare State Maps by Year
View All 1994 Tennessee Maps
Election Tools
Atlas Forum
Image Code for Maps:
County
,
Pop
Data Sources:
Source for Popular Vote data: Tennessee Secretary of State. Division of Elections, "United States Senate - Unexpired Term,"
Certificate of Election Returns for the General Election Held November 8, 1994
(Nashville, 1994)
Source for Population data: U.S. Census Bureau.
Results for and Individual County:
(m)
Choose Year
1964
Choose Office
Choose State
California
Tennessee Election Results Home
-
National Results for 1994
-
Use Frame Navigation
Login
Terms of Use
-
DCMA Policy
-
Privacy Policy and Cookies
©
Dave Leip's Atlas of U.S. Elections, LLC 2019 All Rights Reserved


