Home
2024
Election Results
Election Info
Weblog
Forum
Wiki
Search
Email
Login
Site Info
Store
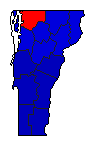
1980 Gubernatorial General Election Results - Vermont
Note: The Google advertisement links below may advocate political positions that this site does not endorse.
Data for this Contest was Contributed by on 2011-09-11
Gubernatorial
Candidate
Political
Party
Popular Vote
Richard A. Snelling
Republican
123,229
58.79%
Jerome Diamond
Democratic
76,826
36.65%
Daniel E. Woodward
Independent
5,323
2.54%
Bruce Cullen
Independent
2,263
1.08%
John Potthast
Liberty Union
1,952
0.93%
Map Key
> 40%
> 50%
> 60%
> 70%
Turnout
Maps
Pop. (m)
Demographic Data
1980 Population:
511,456
Enum.
1980 Population Density:
21.3
persons/km
2
1970 Population:
444,732
Enum.
1970 Population Density:
18.6
persons/km
2
Land Area (2000):
23,956
km
2
Annual Pop Growth Rate:
1.4
%
Election Data and Statistics:
County Data (Table)
(m)
County Data (Graphs)
Purchase Detailed Data
Compare State Data by Year (Table)
Compare State Data by Year (Graphs)
View All 1980 Vermont Data
Compare State Maps by Year
View All 1980 Vermont Maps
Election Tools
Atlas Forum
Image Code for Maps:
County
,
Pop
Data Sources:
Source for Popular Vote data: Vermont Secretary of State.
Governor - 1980 General Election Results - Vermont
, Vermont Secretary of State (vermont-elections.org/elections1/1980_election_info.html) (accessed 11 Sep 2011)
Source for Population data: U.S. Census Bureau.
Results for and Individual County:
(m)
Choose Year
2022
2020
2018
2016
2014
2012
2010
2008
2006
2004
2002
2000
1998
1996
1994
1992
1990
1988
1986
1984
1982
1978
1976
1974
1970
1968
1962
1960
1958
1952
1944
1938
1936
1930
1920
1918
1912
1793
Choose Office
President
Senator
Lt. Governor
Choose State
Arkansas
Delaware
Indiana
Missouri
Montana
New Hampshire
North Carolina
North Dakota
Rhode Island
Utah
Washington
West Virginia
1990 >
Vermont Election Results Home
-
National Results for 1980
-
Use Frame Navigation
Login
Terms of Use
-
DCMA Policy
-
Privacy Policy and Cookies
©
Dave Leip's Atlas of U.S. Elections, LLC 2019 All Rights Reserved


